
I have no idea what price we will close at today. But ideally somewhere close to 1045 would be ideal. It would potentially set up the final catapult needed to flip this market around one last time. I think the bears should be hoping for a strong close today. It would help the pattern similarity. On the other hand, to expect an exact mirror image is misguided thinking as well. Market movements rhyme. They are never exactly the same.
I do have to repeat that the absolute last thing I want to see is another very bullish follow through day on Wednesday. I suppose we could say that ‘max pain’ is the 1070 level on the sp500. Anything above that and this pattern similarity will start to crumble very fast.
The market was declining 7 or 8 days down in a row and it was starting to break some serious records. Certainly a bounce was overdue and today looks like that bounce has arrived right on schedule.
The time factor is still critical in my opinion. This is a short week anyway. So there are really only 3 trading days left for the week after today and then we have the eclipse on Monday the 12th of July. So after today that is a total of 4 full trading days. It does not seem like a lot of time, but the fact of the matter is that this decline started at the end of April and has been progressing since that time, so usually one tends to see the most price movement during the capitulation phase. As I mentioned in a previous post I would rather get the majority of the decline completed by Monday the 12th of July before we get into full blown earnings season. If we drag on too long here there is a risk of entering the highly risky up and down volatility that is usually associated with earnings season.

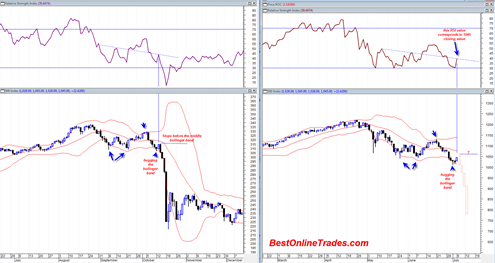
In the chart above I have plotted the 1987 and 2010 price moves with Bollinger bands. The Bollinger bands show that if we are to continue the pattern similarity then today’s rally should stop somewhere near the mid point bollinger line and ideally it would stop at 1045 to create some nice RSI (relative strength index) symmetry as it did during the 1987 period.
I have also drawn in the hypothetical price moves that could lead into July 12, 2010. If we close at 1045 or higher today, then ideally you would want to see the next day ENGULF todays move as well as the previous two days and maybe close near the bottom of the last few days range.
Hi Thomas,
Thanks for keeping the bear flame going. I don’t think we need to follow the 1987 daily grind. If we close at the LOWS today, giving a gravestone doji, it will still lead to a similar waterfall by the close of FRIDAY the 9th of July. The moonphase would be a lot closer to 1987 than Monday the 12th.
Yea you are probably right… I just hope we do not blast above 1042..