
The sp500 today took some more measureable ‘hits’ than we are used to seeing. There may be a case to be made however that the lows are in once again and that today’s decline was yet another case of ‘bear bait’.
The NYSE summation index ticked down today but is not anywhere near a solid signal of a total market break down in my opinion.
The market has had a pattern of initiating sudden ‘shot gun’ type declines and then using them as ‘fuel’ for more eventual upside since the indicators moved into oversold ranges. Of course this type of market action will not continue forever, but it has been the case for quite some time now and the odds makers would probably suggest that this is a good reason for it to continue.
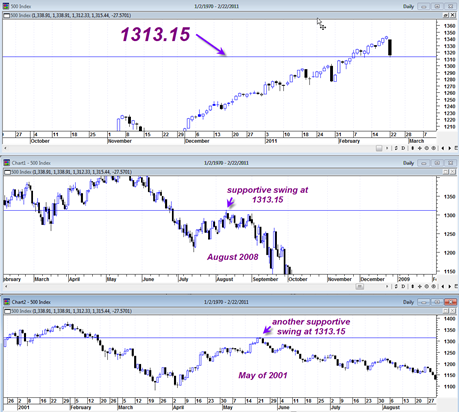
The title of this posting suggests that 1313 on the sp500 may be lucky number. I am referring to the fact that the low of today’s decline puts the market at some interesting swing high supportive ranges of the year 2008 and 2001.

1313.15 is the supportive line that coincides with the important swing high of August 2008 and May of 2001 shown in the charts above. So this could imply that we are going to get the standard upside bounce tomorrow and maybe into Thursday 2/24/2011 as well.
1313.15 seems to be an important support range and could be used at least as a short term guide of whether the current correction will have more depth to it or simply be halted in the current range.
During very strong trending markets, I have noticed that 1 to 3 trading day pullbacks to previous swing highs as shown in the chart above can sometimes be enough of a retest and allow the market to continue higher thereafter.
If we think of the last 2+ week upside move in the sp500 in terms of Wyckoff market methodology we can see that it was a northward Wyckoff break up through the 1313 resistance shelf. In that context today’s decline may simply be the classic Wyckoff retest back to the breakout area. But for the retest to be valid it would mean that we need to hold 1313 in the sp500 in the days ahead.
P.S. It is worth mentioning that I found it quite odd that the US Dollar Index did not show a much larger upside move today. On the contrary it printed a quite bearish looking reversal hammer which could mean a big down break tomorrow (and upside break in the market tomorrow). Today just had the flavor of a manipulated ‘news item’ type decline. Egypt was about to implode and then tanked the market. Now it is Libya and they are doing the same. This script is starting to get a bit too predictable…
Interesting find on 1313. Its possible that on the egypt down day and today as well, was a result of cascading stop orders getting hit. The VIX closed way outside the BBs. Should see some reversal on wednesday.
yes indeed, I am always fascinated at how the market indices respect previous support and resistance levels sometimes going back 10 or more years… the market has memory..
the problem is the bid/ask now with shorts being the lowest since 2007, the rally from Sept was no doubt aided by shorts covering on the way up…..sells at bid were 11 to 1 compared to the buys at ask today on the SPY…who will be the bid?
This guy is calling this decline the perfect storm
http://www.cnbc.com/id/15840232?video=3000006535&play=1
the posting before this one spoke of possible perfect time for 10% correction and NOW you find perfect “hoary” reason that market should go back up. confused is putting it mildly. this happens an awful lot on this blog. gl
*1313 = cardinal climax = june 14, 2011 = what a crock
Geoff – unfortunately this is never a perfect business. Everything is subject to revision as each day brings something new to the technical picture. I agree, we all like a solid direction to act from but an open mind is the best prevention to accepting heavy losses in an unwavering belief. Good luck.