
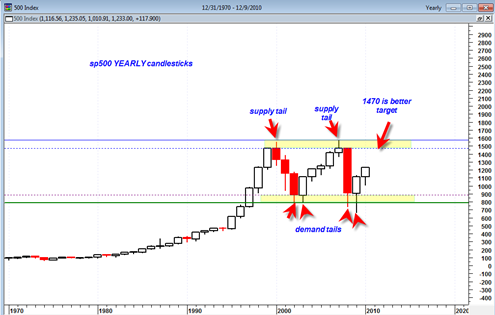
After looking at the yearly price chart of the sp500 I decided that 1470 is a much better target than 1550. At this point I would think it quite foolish to target 1550 based on how the yearly chart looks. It just would not be worth the risk given the significance of the potential overhead supply near those levels.
There are two significant topping tails on the yearly price chart at the top of the range. The 1470 level better defines the more important resistance range.
On the other side of the large trading range 895 seems to define the most important support level to watch.
So 1470 on the topside and 895 on the bottom could be the most important levels of significance on the sp500 for the next 10 years.

Assuming the sp500 does make it to 1470 I would think it quite foolish to continue to be adamantly bullish at that range for either traders or long term investors as there would exist the potential for an eventual swing back down to the bottom portion of the range.
I have to say that this yearly price chart of the sp500 is quite clean looking and provides a good model to work from.