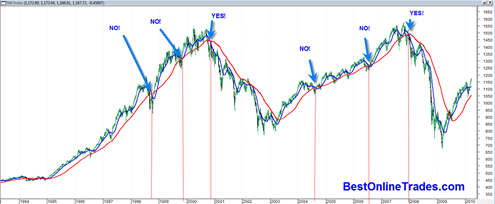
My mindset right now is to absolutely refuse even thinking about shorting this market with inverse ETFS or any other means, until and if the 50 day moving average of the SP500 crosses over bearishly the 200 day moving average.
Now you might say I am ‘slow’ or chicken to attempt to short this market until I get such a long term signal, but I would rather be a slow chicken that takes his time to get on the right side of a trend than super index trading expert hero that feels the need to try to pick the exact top.
For all I know this market may trade all the way back up to the old all time highs in a year or two. In fact that situation has a decent chance of happening based on simple oscillating stock and index theory alone.
The reason why I do not want to try to short this market until I get such a signal is because that is the most reliable signal I know of that marks the indication of when the massive SP500 index of all stocks has potentially transferred from uptrend to down trend. And the down trend situation is the best one for being in the ‘short mindset’, and also where you have the most chance of ‘ease of movement’ to the downside.
In the chart above, since 1994 you can see that there were really only 2 valid superb short phase opportunities where most of the money could be made shorting the market. Four of the signals were false signals to short the market.
So the key is, when and if the 50 day moving average crosses bearishly over the 200 day moving average, to start to more carefully watch price to see if it then at that point is willing to break down again with ease of movement as it did in the two periods above.
But right now, the 50 day moving average is nowhere near the 200 day moving average and I suspect that the first 1 or 2 touches of the 200 day moving average in the months and years ahead are going to be false signals to short similar to the way this occurred in before 2000 time frame and before 2007 time frame.
By the way, there is a date to keep in mind for forward looking purposes and for the purposes of identifying possible turning points in addition to the 50 DMA and 200 DMA system I talk about here. The forward date is:
August 17, 2010
This date has the potential to be extremely significant as a turning point. It is not my date but is one pointed out by Larry Pesavento, the famed Astro trader. He indicated that this date is extremely significant as far as astro aspects are concerned because of the extremely rare situation of 5 separate planetary aspects all converging on the same day ( actually I am not sure if it is 5 or what the exact aspect is but I know it is very big).
So knowing this information and knowing also that the market looks like it still wants to push higher for quite some time, it would seem that August 17, 2010 has the potential to be a very good turn point date.
So this August 17, 2010 is the only exception to the rule I am going to make with the 50DMA and 200DMA crossover scenario.
If we are lucky and see the market go up in almost a straight line right into August 17, 2010, then it might be worth a try to short on or very close to that date going into the seasonally weak September 2010, October 2010 time frame.

