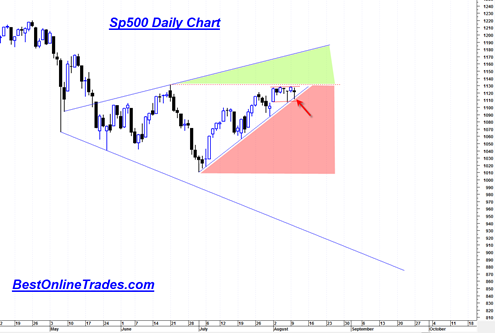
The market got a reversal going today but it was somewhat sloppy. The signal I was hoping to get from the SMH Semiconductor HOLDRs (ETF) did not really transpire. The SMH got a pretty strong looking reversal hammer today but for it to be confirmed it must close above 27.45 tomorrow, otherwise it could be a false reversal.
The volume in the Semiconductor HOLDRs (ETF) today was 24.2 million shares which tested the 7/30/2010 price swing which had 21.5 million shares. So we tested that price swing on 12.5 % greater volume. So it still looks like the SMH could break down from here completing this A B C down leg and maybe drag the sp500 with it. But this will probably not be the case if the SMH can tomorrow confirm today’s hammer reversal candlestick and close above 27.45 tomorrow.
The sp500 itself is still bound within the same pattern I have been talking about for quite some time now. There really is no ‘news’ about the next trend until the market tells us what the news is. Today on the sp500 we every so slightly busted below the up trend line in force since July 1, 2010. The volume was also much heavier and similar to the level of last Friday. But the market still finished with a hammer type reversal candle today and we did not test yesterdays swing high, nor the swing low from the day before yesterday.
We are close to a big move in the sp500 and a lot of stop orders are about to be hit at the top of the recent 7 day sideways rectangle trading range or at the bottom of the range.
I have been trying to step ahead of the market and guess which way it will bust based on the trading pattern of the SMH. So maybe the SMH will reveal the final clue tomorrow based on what I said earlier in this posting.
If you look at the NYSE McClellan Summation Index chart there appears to be a divergence developing between the oscillator and price. Also the oscillator is coming close to breaking below the zero line. I think the summation index is about to curl over negative soon but it might take the rest of this week to do so.
The stance of the summation index chart and the SMH gives me a little bit more added confidence that the market could roll over to the downside soon. We are sitting right now within the 3 day range of this extremely powerful astro cycle (August 8 to 10th) and it could very well be the market is topping right into this cluster of days.
More confirmation is needed for a stronger sell signal.
A powerful confirmation signal will come in the days ahead if the 5 day exponential moving average crosses down through the 10 day exponential moving average of the summation index.
I will be watching for this signal in the days ahead.


This is the article of the month. Also the rising wedge showed the two line converging and a move was easy to predict. All in all very well done Tom.
Thanks man. Yea it looks like the SMH combined with the summation index was the correct combination of clues, combined with the volume analysis. Plus it looks like the Astro is working today for a change.