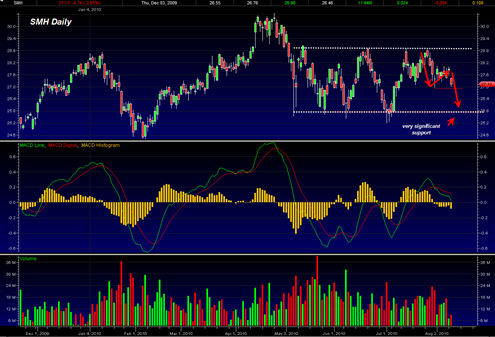
In a previous post on the Semiconductor HOLDRs ETF I indicated that it looked like it was about to break down in an A B C style decline. It has already broken the uptrend since July 1, 2010 and today is breaking down again on what appears will be a very heavy volume day maybe greater than 20 million shares.
My theory was that the Semiconductor HOLDRs ETF would drag down the rest of the market below its lower rising wedge supporting line. So far that has not happened but the sp500 is sitting once again right on the bottom supporting line of the recent channel that began July 1, 2010.
The SMH looks like it wants to test the 26.95 level which also represents the very important swing reversal low of 7/30/2010.
I wish I could say whether or not the SMH is going to blast below the 7/30/2010 swing low today on very heavy volume. The problem is that the pattern lately has been early weakness and then a reversal by end of day. Plus we have the FED meeting as a possible catalyst and/or turning point.
It is very clearly seen that the SMH is right now almost dead center in the middle of this long trading range since end of April 2010. We recently failed to break out topside from the the top part of the trading range in the form of a small double top. Since then we broken down on heavy volume and then rallied on light volume and are now breaking down on heavy volume again.
If I put my Astro hat on, it tells me to expect unprecedented volatility the next 2 days. The way the chart looks and the way the Volatility Index is setup right now tells me a huge downside move could come out of nowhere.
You know what? I think I just convinced myself that we are about to trade down in a big way. This is my sense from looking at the SMH chart right now and the sp500 chart side by side. I don’t think the bulls are going to be able to get enough of a reversal today. I think we are going back down to the bottom side of the trading range on the SMH. That is how the volume pattern looks right now.
The setup looks a little bit similar to the way the May 6, 2010 flash crash began.
The SMH has tested the topside of its trading range 4 times and the bottom side also 4 times. If it cannot break through topside then it will turn around and try to take out the bottom side of the range, just like a tiger in a cage.


Tom
You do not lack for “cajones”. Your predictions have been so off the mark over the past two months that i recall you labeled one of them “Fade Me” or something to that effect. I shudder to think what your conviction of today will bring. However, I hope at long last you are correct! Fingers crossed.
In hindsight the only prediction that anyone should have been making since the July 1, 2010 low was that the market is in a new uptrend and so far it has hit the up trendline 4 times.
That is the main point. The daily predictions about the next move is ‘noise’ compared to the importance of the trend since July 1, 2010.
Predicting that a trendline will be broken before it actually is, is probably not a good idea. But I seem to do it lately anyway.
Maybe going forward I am just going to say, if we break level A it will be bullish, and if we break level B it will be bearish and then just let the market decide. That is the way it should be.
Making daily predictions during the last 6 days is probably unnecessary unless it is day trading.
What is your thought on AMZN ? WTF is up with that stock ? Why is it rocketing high after a terrible earnings report?
It looks like a decent up trend but admittedly on low volume… this stock is a major mover in the dot com space and has huge brand name and plenty of leverage with some hot products gaining momentum.. I would be careful betting against them. Sometimes stocks just move higher in large swing trading ranges even though earnings or revenue are not perfect.