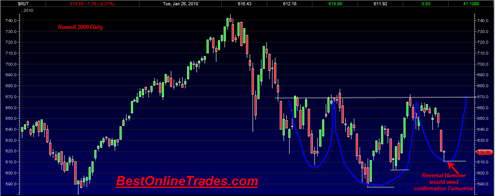
The Russell 2000 today is printing a reversal hammer that looks quite typical and reminiscent of the reversal hammer of 6/8/2010. In the large swing trading we have been in over the last few months, these reversal hammers have been somewhat famous for picking exact bottoms in the markets large swing trading range.
Today’s reversal hammer is also significant if you look at it in terms of the previous reversal hammer on 6/8/2010 in that it shows possible symmetry. The symmetry I am referring to are left and right shoulders of a head and shoulder bottoming pattern.
The volume pattern on the SPY and many other indices has been a series of surges at these major swing trading lows since beginning of May 2010, but relative to the previous surges they have been progressively less. That drying up of volume on a relative basis does not seem to be the stuff of a new bearish breakdown.
When you consider the drying up of volume (plus the high TRIN reading yesterday) with the pattern in the Russell 2000 below it would seem to confirm that we are once again near a reversal point here.
Having said that, a hammer reversal candlestick is not a hammer reversal candlestick until it is confirmed. We need to see a close above the high of today’s Russell 2000 Hammer before it can be said we have some kind of reversal going.
The last point to be made about the chart above is that today’s low is still a higher low relative to the last two valleys of July 6 and July 19. The better sign of a character change in the market would be a break below the 7/19/2010 low of the Russell 2000 of 602.64


Tom
What is your current take on RUT after the close today on 13-August.
I am doing to do another short post on the Russell within the next couple of days.. Thursday’s candle was actually not a reversal hammer at end of day and today’s reaction was weak. It looks like it wants to go lower.