
Today was very uninspiring for the bull case on many indices and in many different aspects. Volume was lacking today in a big way. Price conviction was lacking also. There were also plenty of reversal hammers created which would be confirmed on a close below today’s price low.
The Dow Jones Transports Average is showing three fairly significant topping tails in 3 of the last 4 days price action and addition to today’s reversal hammer. These are not bullish signs. They are signs supply is coming into the market yet again and supply is winning and may shift momentum here back to the down direction.
The IJR S&P 600 small cap index did show a bearish triple M on the histogram today which may be confirmed on a close below today’s low today on that ETF.
The weekly price chart on the S&P 500 is showing we are inches away from a bullish weekly MACD upside crossover. Because of the complex trading range markets we have been in, simply trusting or believing the weekly MACD cross at this point is probably not a good idea. The weekly bullish cross could turn into a bearish weekly MACD kiss if and only if tomorrow is a very hard down day. On the other hand I notice that the NYSE Composite index which is very broad, does already have a bullish weekly MACD cross after an initial failure cross.
I will go long the TZA tomorrow morning assuming there is an indication that the market wants to open weaker and if I see indications that the sp500 will get back to 1100 and stay under 1100 for most of the day. If on the other hand I see a strong open and consistent strength throughout the day then the TZA is probably a bad idea.
There is still the risk that today’s cumbersome breakout attempt was just a head fake. But I have to trust some of the short term signals I am seeing.

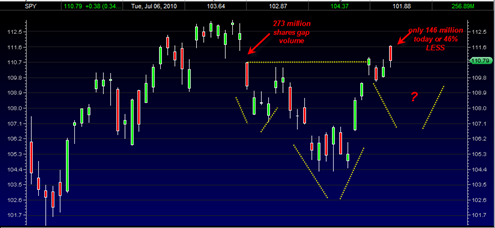
The SPY chart above shows that today we closed under the high of 3 days ago but we also pushed into the high volume gap of 8/11/2010. We pushed into that gap with 46% less volume which is certainly not bullish.
Also in the chart above I drew in at least a possible small head and shoulders bottoming structure that may eventually take shape. If correct then 107.50 would be the low of the right shoulder or near that level.
With all that better-than-expected data that we’ve been fed, today was as good as it gets for the bulls — and they even failed to test 200-day MAs. This market definitely wants to go lower.
At the same time, a good bloodletting would be great for the longer-term bullish scenario,