
I am about half way through reading the book Reminiscences of a Stock Operator by Edwin Lefver which details in story form the trading skill and observations of Jesse Livermore. It is a truly fascinating read. What impresses me the most so far in this book is Livermore’s ability to trade with high confidence at certain points in the market when he really knew with high conviction that we was right. Then he had to prove he was right by putting his money to work in the forecasted direction. He scaled in at first to see if the market confirmed his forecast and if it did then he added along the way sitting tight as ‘uncommon men do’.
If Livermore was trading the sp500 right now I think he would be adding to his long position on any pullbacks. And I suspect also that he would be long since 9/1/2010, at first scaling in to see if the market was confirming his bullish conviction or not. So far I think it is quite clear that the market has confirmed any ‘test orders’ with bullish conviction since 9/1/2010.
So now the question becomes will it continue or not?
I believe it will on the longer term time frames but I have to be very clear about which time frame I am talking about in the context of the recent rally. It can be very confusing to read someone’s take on a market when they are not clear on time frames.
The Monthly Time Frame
I am starting to become adamantly bullish on the Monthly Time frame. There are a few ingredients still missing, but I suspect we will get them within a few weeks time. The monthly time frame is one of my favorite time frames because to me it defines the bull or bear market context in long waves and almost completely removes the small ripples that can be so hazardous and distracting.
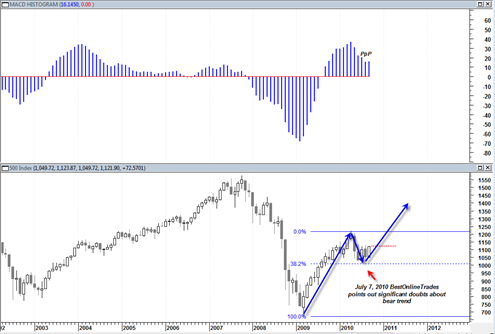
It continues to be fact that the Sp500 has still only done a 38.2% fibonacci retracement of the bullish run from March 2009 to the April 2010 high. I am almost shocked at how infrequently this fact is pointed out by market technicians, the business media or trading message boards. Instead of this fact being pointed out, the so far failed head and shoulders topping pattern has been emphasized instead.
One of the most profitable penny stock trades I made a couple years ago was in a penny stock that had a very strong advance, then paused in a 38.2% Fibo retracement, and then continued higher into leg C. The same setup exists right now in the stock market.

Despite my bullishness on the monthly time frame we still need confirmation of the monthly move higher which would likely occur in October. Right now for the monthly September candlestick bar I see that we have a bullish triple P in the MACD histogram. This bullish triple P is so far unconfirmed. We need September to close strong higher ( I believe it will ) and then we need an October close above Septembers monthly candlestick. That would confirm the bullish triple P in the MACD histogram on the monthly chart.
I am continuing my longer term bullish stance ahead of that confirmation because of what I saw in late August in terms of volume reversal indications.
The Daily Time Frame
The daily time frame is obviously more volatile and variable, however I do expect to see more trend strength than we have seen in the recent past because we are starting get more bullish alignments now.
Using the XLF as an example, note that the daily shows once again that we are moving to the top resistance range that has in the past proved so powerful.

I expect that we should move a bit higher into the red shaded resistance range and hopefully start to test some of the swing highs going back to May 2010. The volume comparisons will be important but also the observation on the expected pullback once we get into this resistance range again.
I expect we will pull back after hitting this range, but the KEY will be the nature of the pull back and the ease of movement to the downside. I believe the pullback will not be as severe as in the past and will provide a potential catapult to eventually shoot the market higher over the resistance range (perhaps in late September? or very early October?).
So you can see how a bullish monthly could evolve within a daily context.
The next 5 to 10 trading days action should reveal some important further clues on confirmation of the points I am making in this post.
P.S. I have been thinking of creating a BOT Index Timing chart of the SP500 where I show right on the chart exactly where I am indicating a ‘long stance’ or ‘short stance’ so that I can better keep track of my BOT timing signals on the indices (the sp500 specifically). I have to think about how I would set it up and where I would post the chart. Index trading was never really my forte, but I have been writing so much about the sp500 and my timing ideas on it since April 2010 that I think it is high time I start to put my finger on the chopping block and show right on the chart over time where I am indicating long or short stance. I would indicate in my postings when a change in signal is to occur and then post it on the chart. I have absolutely no idea how successful (or not) this would be. But I think it has the potential to be a very good learning process for me and maybe someone else. It would give me a reference point where I made wrong signals and then a chance to study to SEE WHY I was wrong so hopefully such a mistake would not be made again in the future. I suppose the most appropriate thing to do would be to have a more short term oriented BOT index timing chart and then a more Position BOT index timing chart which focuses more on intermediate to longer term trend.