
I have been trying to come up with some reasons why the market (sp500) could be at some type of turning point here and head down.
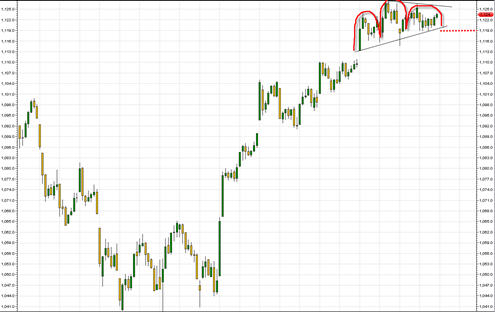
The 60 minute chart on the sp500 shows a possible small head and shoulders top over the last 4 days, but there has been no break down through the small short term neckline.
The McClellan summation index and moving averages are still in bullish mode.
We have a couple dojis and narrow range candlestick bars over the last 4 days indicating possible pause in trend but no real determination of change in trend back to down.
I could be wrong but I think I have to maintain the long bias here, and that the recent dojis and small bars are the market ‘chewing’ through previous resistance without much price give back. I am thinking that the market is absorbing the sellers into the current resistance range.
If I am correct then we should see another big move topside soon to clear the market above resistance at 1128 and try to convert that resistance into support.
If the sp500 breaks under 1119 tomorrow 9/17/2010 then perhaps the small head and shoulders 60 minute time frame will start to work, but until that happens I think the long bias is still correct here.

The small head and shoulders top on the 60 minute chart also has the appearance of a symmetrical triangle or small bullish pennant which would favor the bullish side.
1119 appears to be the key level here that must hold for us to be able to stay higher and break above resistance.
Hey Tom,
The only reason I can think of is markets love to sell off on Fed Tuesdays, and, given it’s September and we’re sitting near the top of the summer trading range, it can be pretty harsh.
Yes Max, that makes a lot of sense and has been typically the case a number of times in past… so maybe Tuesday is the better decisive day…