
Yesterday I issued a ‘BOT Short’ signal. If yesterday was a ‘probe’ short then today does not seem to be providing the confirmation I was looking for. There is always the risk that we are in a running correction and that we will blast higher Monday as seems to be typically the case in this market. However I will hold on through Monday and see if Monday can provide some real confirmation. I did add to my short position by getting more VXX November 19 Calls. The VXX looks so extended to the downside that it looks ripe for an upside launch. Seems like a good risk reward. Actually the VXX outperformed most other leveraged ETFs during the April 2010 to Early May 2010 period. The VXX was up almost 100%.
The average volume analysis on the SPY ETF I did the other night at this point has me very concerned. It shows that despite the greatest upside rally in over 72 years (as the popular headline is being thrown around), that ‘greatest’ rally was on very LOUSY volume and in a consistent pattern of 13% less and then 8% less volume on previous rally legs. Of course you will not hear that headline anywhere else in the business media although maybe I ought to send the link above to Bloomberg or a few other business media outlets.
The other thing that has me very concerned was yesterdays doji in the indices. It looks like a ‘Rickshaw Man’ doji candlestick. I just looked in Steve Nison’s candlestick book and he indicates that the Rickshaw Man doji reveral candlestick (or long legged doji) has the potential to be especially bearish in terms of turning points near tops.
The tricky aspect to these dojis is that one does not necessarily always get immediate follow through to the downside or upside. The market can drift around for a few days and then start to head down after that making it seem at first like the signal failed. But I think this signal is going to succeed.
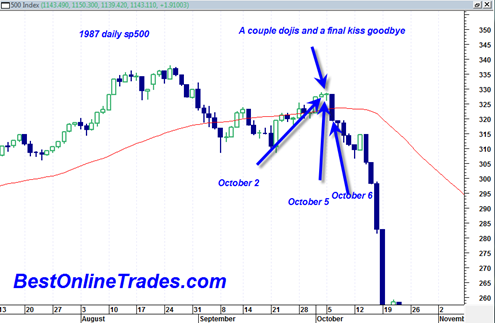
I also find it interesting that the current perceived momentum shift in the market from up to down now is occurring at almost the exact same time frame calendar wise as that final ‘rally of hope’ during late September 1987 (see chart below).

Am I too bearish now? I could be, but the volume analysis and that Rickshaw Man doji is really quite concerning to me right now.
Still, I thought that today would see some immediate follow through weakness down, but it did not happen. The volume today in the SPY is business as usual (light and lame).
Obviously if we gap and go higher Monday in the AM, I will once again have to cancel out this BOT short signal. But I am still holding onto the possibility that we are on a ‘delayed short signal’ with the market just drifting for a few days before it gives up. We really ought to have better confirmation by Monday in the AM. . .
I think the real bearish pattern on both the current daily SPY chart and the 1987 chart you posted, is the long Bearish Engulfing Candle we put in yesterday and on Oct 6 on the 1987 chart. The fact that these candles engulfed more than one candle (on both charts) and the volume increased yesterday compared to the day before, makes this an even more significant formation according to candlestick experts
my 10 day moving average of Advance Decline on NYSE has hit 21 days of advances. this is long string but not terribly extreme (30 to 33 would be very extreme). this only tells me that at a minimum some negative AD days must be coming.
the 10 day moving average of Trin / Arms index is currently sitting flat at 1.00 but this 10 day average has been at 1.07 to .80 to 1.00 for sixteen trading days. . . again this merely provides “room” for some very negative days if they come about.
today was pretty negative for some high profile high fliers – – e.g. Netflix, Amazon, Open Table, and even Apple had a down day – – – all of these names have slow stoc at 80 or above for very extended periods of time (30 + days) Open Table has the most extreme slow stoc that i can recall ever seeing – – except maybe in the heydays of early 2000 and the dotcom bubble.
investor sentiment is so-so, not overly bullish but by no means bearish. i do not personally “smell” anything of significance about to happen – – but maybe that is false sense of security. i remember 1987 and the months before – – – i somehow knew that a crash was coming (but nevertheless was very surprised when it did come). i do not get the same sure sense today. the EW’ers seem very sure that it is very near. certainly this very gentle and persistent uptrend seems very very similar to March April 2010 which seemed very fake.
I went short today too by selling the SDS October $30 put.
Investor Sentiment
http://www.aaii.com/SentimentSurvey
-Ed Thanks for pointing that out. Yes it does make sense that the higher volume nature of the reversal candlestick gives it more credibility and weight. Could be sign of distribution.
-Geoff Interesting you mention the cult stocks as I was looking at all of them earlier as well and thinking they are showing some strange weakness. A nice chart on AAPL here that got me thinking about it as well http://clearstation.etrade.com/cgi-bin/bbs?post_id=9512624 Also unusual was that the US dollar was down so heavily Friday but the market barely up. Market should have been up 200 points Friday given the drop in the dollar index. But I am going to do a post on the US dollar index this weekend because it seems to be right on a decent support level and could bounce up next week causing stock market to head down.
As far as current sentiment readings, it sure does confuse matters quite a bit. Ideally we would have raging bullish sentiment now to support a bigger drop.