
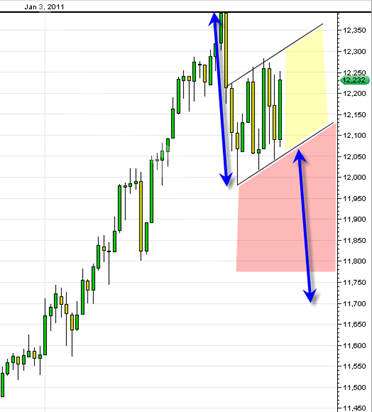
The Broadening wedge formation in the sp500 is still filling out its formation and in general I am viewing this as an eventual bearish resolution type pattern with the outside potential of it turning into a very bearish cascade type decline resolution.
Rising Broadening wedges are a very frustrating type formation because there exists an up trend and yet it is an uptrend defined by an expanding trading range which can be very difficult to identify in the early formation phase.
The weekly MACD and the weekly histogram on the sp500, the nasdaq and the DJIA all see to be confirming the idea that we are topping now and should get a bearish resolution out of this pattern. I have to say that I will be utterly shocked to see a very strong (and quick) bullish resolution out of this pattern the next few weeks. I have been shocked before, but I truly will be this time around if we see a bull resolution out of it.
There are a number of reasons why I think we will get extended bearish resolution soon:
- The weekly MACD is almost at a negative crossover and curl over point. Sometimes the actual crossover can lead to a bullish move, but the potential bearishness of the crossover is undeniable. My chart work is showing that this bearish crossover should occur either by the end of this week or next week. That should mean hard down prices soon.
- The DJIA appears to be trading in a violent trading range both up and down lately that defines a rising flag formation that has a clear measured down move.
- I am seeing head and shoulder topping formations on most of the indices.
- I am seeing 3 weekly hanging man candlesticks on the Nasdaq Composite which are still unconfirmed, however to see three of them in a row is a worrying sign.
- The negative heavy volume versus light up volume relationships on the SPY ETF in the recent 3 weeks looks much more bearish than the consolidation that occurred in November 2010. This time around I am seeing much more consistent heavy volume down moves that are more regular and heavy. The up days volume is horrible. This volume pattern suggests to me strongly that we are undergoing distribution currently (big money is moving out of the market). Of course 200 point DJIA up days like we see today are a completely DISTRACTING smoke and mirrors situation that blinds those who don’t also look at the volume relationships.
- If we eliminate all the points I just made above, then just the simple anecdotal point I mentioned in a previous post could be enough reason for us being at a top. The anecdotal point I am referring to is the sub headline on CNBC a week ago that already quickly presumed in question form "on the next leg up will financials lead the way?”.
- NYSE summation index is back in bearish trend mode.
- High flyers such as NFLX on the monthly chart created a huge topping tail on the monthly candle and point to bullish exhaustion for some techs
- AAPL also looks ready to start a bearish trend again.
- The VIX volatility index has a bullish weekly trend and broke out of the long term down trend line.
- The US Dollar so far has not busted below its long term 3 year up trend line and so far on the monthly candlestick is showing a March reversal hammer that could lead to bullish resolution for April. If the inverse correlation with the sp500 is still valid then it supports the case of a big down move in stock market and big up move in the dollar index off of support. Perhaps this would be related to the ending of QE and a tick up in rates to support the dollar?
The market today had an ‘inside day’ in that the high and low range was compressed within yesterday’s high low range. It will be interesting to see tomorrow whether the market will create a ‘double inside day’ if it once again can create a lower high and higher low than today’s range. If it does, then it will mean with good probability that a huge move (either up or down) will be in store for Thursday or Friday.

On the bullish side one can still make the point that the market is still trading with higher lows and has not violated that trend yet. But the bearish flag formation and the broadening wedge are the better focus for now in my opinion.

The above chart shows the hypothetical head and shoulders topping formation and important to note that frequently the left and right shoulders are typically of the same time duration. The right shoulder needs to fill out a bit more but is also consistent with the weekly MACD turning into a bearish resolution soon.

The chart to the left is the DJIA and shows this apparent rising flag formation with a possible resolution down to 11,700.
It should be noted that this rising flag could continue to construct itself for quite a while longer. In other words, the market could trade up and down within this swing trading range for quite some time more.
In the first chart at the top of this post one can also see that the sp500 is trading in the form of a symmetrical triangle which points to either an upside reversal out of it, or a follow through break down. The intra day chart of the sp500 seems to point out that another day or two should complete the formation of the triangle.
The bottom line?
The bottom line is that if we are going to see weakness then ideally we would see it into end of this week and end with a weak Friday.
If the sp500 breaks above 1332 either this week or next then I have to really start questioning the bearish forecast. Breaking significantly above 1332 would also bust the market above the 78.6% fibonacci retracement level which seems to be the last line of defense for the bearish view.
I am looking at the testing point around SPX 1332. Could go to 1352. But probably will break around 1335-40.
So here is my scenario. Continued choppy action, but moving on average upward.
Close to the 1335 technical resistance point, War with Libya will happen, with a very, very strong break to the downside confirming all of our technicals. This could be quite a strong downdraft. Then as the War drums moderate, and Libyan Oil winds up in strong hands, the oil panic will subside and the market will return to its climb to the upside. Reaching new highs before June!
This could be an incredible opportunity.
Nice analysis JR lets see how it shakes out…
The only problem I am having is how the oil rally will subside. Even if it corrects, it looks very bullish longer term and I am having a hard time figuring out how the market can rally with 140 to 200 dollar oil…
Tom
thxs for all the hard work.hope your assumptions pan out and your work pays off.
Have the dollar bouncing from here. Of course this would make U.S equities less attractive to foreign buyers.
Still think Qudafi is a time bomb. Trapped with no money or escape route could trigger one last big FU to the world as he self destructs and takes his oil fields with him
Tom
Great anylsis thanks you do put alot of effort into your posts. I also noticed that TZA, VXX, FAZ your leading reverse ETF;s have really increased in volume as of late. Could be an indicator of a reverse at hand.
JR good job playing devils advocate. This would be inline with my comment about what happened in Nov when we all thought a reverse was at hand and it took off. I am inclined to go with this scenario as I see more sideways action coming across to the 50 on the yearly chart. I looked back and dont see where the down setup took more than 3 weeks. This scenario also coincides with the 21 55 cross on monthly in the june timeframe.