
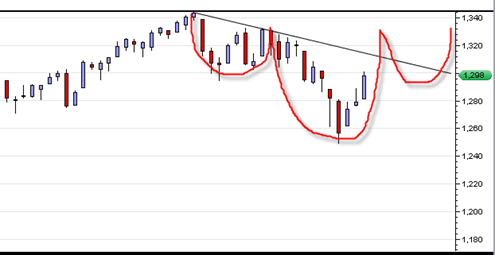
The bearish case I have been ranting about in the sp500 may be dead as of today. Especially if we close near the highs. If we close above 1300 it could mean a swift move up to 1330 and only THEN some type of retracement which would lead to a right shoulder forming of a head and shoulder bottom formation.
This market has been characteristic of blowing the bears away and in true form seems to want to do it again. Whether or not it can accomplish this by the close remains to be seen.
The way that the Nasdaq 100 has been retesting its 2007 highs was definitely a concern for the bearish case. Why? Because it could simply have meant that the decline is over up to this point and a simply retest of the 2007 was at hand. Today we see a strong reaction up off of this retest and it really does cause issue/concern with the more bearish case.
There is also something else going on now, namely the US Dollar index. It has broken down badly out of a 5 year symmetrical triangle formation. This means that equity and commodity prices are likely to be supported. This is basically the same pattern that has been happening for a long long time now. It will probably mean that the DJIA will be able to get to very large numbers while the real buying power of that number is maybe cut in half.
The ‘system’ wants to pump this market higher ad infinitum to get the president another 4 year term. This is a massive inflationary push maybe never before seen in history.

I am switching back to a BOT long signal above 1317 on the sp500. It is true that we are still in a down trend from the top of 2/18/2011. This down trend channel has not been broken yet, so it could be that we will stay in a bearish trend but with high volatility in both directions. But anything above 1315 to 1217 and that down trend line will be compromised.
Sometimes the first bearish trend off of a previous very bullish trend is very whipsawing. Some are saying the current top is the same as the 2007 top formation. I am not so sure about that. I think there is a decent chance now that the entire decline is over and now it is just back and fill and then break out to new highs ‘eventually’.
Maybe the close today will show something different but for now this has to be my take…
Today’s market action is truly bizarre.
Here is an excerpt from today’s N.Y. Times.
A recent survey of prominent global economists by The International Economy magazine found that a majority view it as likely that some combination of Greece, Ireland and Portugal will default on debt and force bond investors to take heavy losses. Oil prices have risen nearly 11 percent this year. Japan already is the largest importer of liquefied natural gas, and as it searches for energy to replace a fractured nuclear grid, analysts expect these prices to rise as well.
Finally, there is the United States, an economic colossus burdened by a foreclosure crisis and the worst long-term unemployment situation in nearly a century. If Japanese companies and investors retrench, selling some Treasuries and investing fewer yen overseas, the pain here could grow.
Bernard Baumohl, chief global economist with The Economic Outlook Group, was until recently quite the economic bull. No more. etc.,etc.
War, a U.S. Federal Government going broke, disaster in Japan of Biblical proportions, EU falling apart, European Banks Bankrupt, US unemployment at unabated highs,
OK, we have Fed action that creates some upside, but where is the correction?
Almost all technicals are bearish!
Hedge funds are listless and under performing.
So what is propelling this market.
Like they say.
If it is too good to be true, it is not true! What is this a great Ponzi?
something really stinks here.
Please someone tell me what is going on!
I say we see one more up day tomorrow. The rest of the week will be down. I see the market moving kinda sideways now under the 21 for a time then back up. According to the calculations this was about an 8% pullback. This is double the previous pullback. Fake money does a lot for an ailing econonmy.
Well it has looked like it should go down for some time. The worse it looks the more they short. So when Bernake injects his funny money into the market, the market goes up and shorts cover, adding fuel to the bull fire. This drama has played out all the way up. I swear the powers that be create the perfect technical set ups for shorting the market and when they suck everybody in, they crush them.This will keep working until it doesn’t
After a little sideways action, looking at the monthly i say we keep going at least till June when QE2 runs out. Then we will have to see how the market reacts.
What does Larry mean when he says “now under the 21 for a time?”
I believe he is referring to the 21 day moving average. Not sure if he means the exponential moving average or the simple moving average…
I will tell you what is going on.. the market has very little to do with the ‘news’ out there. But most of the major business media will tell you otherwise.. They always have to attach a news to every market move which is ridiculous.
Many times in history the movement of the market was very out of touch from what the popular ‘news’ was…
According to Marty Armstrong, all the government indebtedness and other macro problems are bullish for stocks. Stocks are seen as a safe haven from the government mess.
Earthquakes and the Middle East are not going to sink this market either, I think it is already priced in.
The dollar is toast and that means the market can rock higher.. I think that is the bottom line for now..
Hey All,
Yes I meant the SMA 21 on the daily. Yep agree about the news, not sure why they have to do that. IT is just a technical reason and leave it at that. If we can pop up over 1303 this week then I think it will be off to the races yet again. It seems to want to do that. However, if we dont stay above 1303 for the week, then dont fret Tom, your bearishness will return. I figure about 1267 on SPX, then just kinda sideways for a couple months. Weekly chart seems to look exactly like the May weekly of last year. The indexes had to come backto the SMA 5 on the weekly chart. So we will see, we still have a lot of money pumped into the market as yet at least till june, then it’s anybody’s guess.
Ohh boy this ought to be good tomorrow. News across my RSS.. Steve Jobs to be deposed. Wonder how that news is going to be taken.