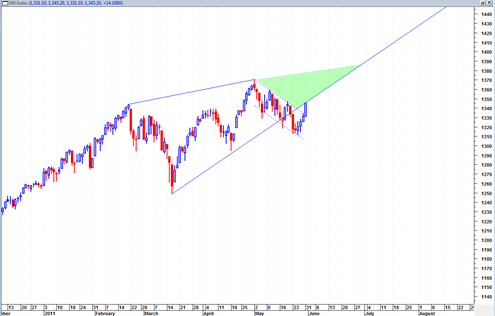
The sp500 today broke out north from the tightly compressed downward sloping trading channel we have been working through the past several weeks. The market appears to want to move higher again to a new 52 week high eventually.
At this point this is a clear long signal again, but I am holding off switching to BOT long signal and instead take a wait and see attitude on whether the market can make a new 52 week high. We are only about 8 days away from the June 13, 2011 cycle turning point of Marty Armstrong and I would rather wait and see if any type of turn occurs on or near this date. This is partly why I am just switching to neutral for now.
You know the old saying ‘a wolf in sheep’s clothing’. Well in this case the wolf is the long side and the sheep’s clothing is the neutral side. Basically I believe the long signal is correct going forward again, but I would rather bide my time and stay with neutral until I see true northward confirmation.
Put simply, I want to see full sp500 price bars above 1370 before switching back to long signal. That should be more than enough time to see what, if any, effect the 8.6 year cycle point has on the market.
The close today in the sp500 puts us right back under the up trend line that was broken a little more than a week ago. Moving back into the green shaded area would put the sp500 ‘back in trend’ and help the bullish case.
A bearish case would be a stall at current levels and inability to trade back into the green shaded area.
Since February of 2011, this market has shown that it has trouble trading in a powerful uptrend. It is still an uptrend but it is more choppy. So I would prefer to see above 1370 before becoming fully convinced on the long side again. By then, the Marty cycle point should be out of the way and perhaps the market will shrug it off, or not.. will just have to wait and see.
I also noticed today on the long term chart of the Dow Jones Transportation Average that it is at an important long term juncture on the 10 year chart. The DJTA is now in a position to either start a deep correction that would create a large right shoulder of a head and shoulders bottoming formation, or it could simply chop a bit longer in the current range and then bust out north creating new life time highs for this index.
I am thinking now that the transport average is going to bust north from the current minor consolidation and trade into new life time new highs which will be very bullish for the overall indices and markets in general. I am happy to be proven wrong, but so far the transports have not shown (from the monthly tape action) any desire to fall apart. If they are going to do so, then June 2011 appears to be the month of opportunity to create a large shoulder bottom formation that has symmetry to the left initial shoulder. But again, I do not see it happening right now. Perhaps the best window for a possible break down is right into the June 13, 2011 cycle turning point.
Breaking to new life time highs in the transports is quite an important feat for this average. It would be breaking above the 2007 highs that marked the start of a severe bear market. There are already other indices that are at new life time highs, the RTH (retail holders) for example. So it would seem to make sense for retail to lead the transports into follow on life time highs.


Criminal federal reserve does it again. Look at how the dollar got bitch-slapped today and as a result the markets rallied. This is the biggest tool fed reserve has at its disposal-debase the greatest currency in the world to prop up the markets. Simply criminal. We’ll probably test the 52 week highs, but I’m still not sold on this breakout. This may be one last squeeze before another downturn. By the way Tom, good call on SLV bounce. I was too scared to pull the trigger and missed out.
In hindsight, plse explain what was the significance of the 8.6 year cycle point that precedes this upcoming June13th 2011 date? In other words, what was the significance of roughly November 30th 2003?
The significance of the previous cycle point in 2003 was that it was a major low and end of the previous bear market. It was not an extremely precise turning point, but it was precise enough. The market rallied up into the next cycle turning point of 2007 and topped there.
2003 was a major low per that model…. now it is looking like we could be at a major high for the model given today’s price action… price action today is telling me the model is working its magic again…
you must be joking or you think i am extremely gullible