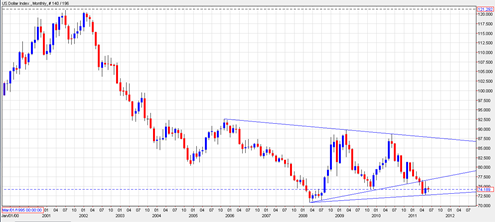
A death spiral would occur for the US Dollar index below the 71 range in my opinion. Currently the dollar appears to still have broken down out of a very large symmetrical triangle formation. It is debatable exactly which line marks the lower boundary of the triangle formation, but the current monthly chart of the US dollar index still looks quite bearish to me.
If the current monthly chart of the US dollar index does not exactly look long term bullish. There has been a strong bounce recently but all of it was retraced to the downside so far. If we break down lower than when this bounce started it could mean a real plunge again for the dollar index.
Personally I think the higher lower triangle boundary is the valid one which would mean that the US Dollar Index’s attempt to break back up and into the large symmetrical triangle so far has failed. It has had two monthly rallies attempting to get back inside but so far has failed at the lower boundary.
This could mean that it will continue to fail in the current range and break down again which could mean another leg higher for the stock market and gold.
I cannot rule out that the Dollar is bottoming on the Marty June 13, 2011 date. It is a possibility. But we will need to see this index get much stronger footing in the weeks ahead for that to be a real possibility.

