
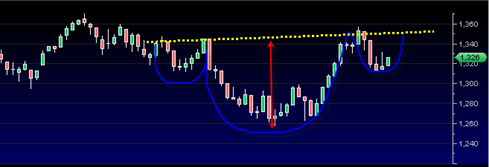
There is a near term head and shoulders pattern in the sp500 that projects to about 1430 which by definition would be a breakout in the sp500 in the weeks ahead.
I find it somewhat unusual to see a head and shoulders bottoming pattern form right near the ‘high’ level of a market advance. I cannot speak to the reliability of such patterns near the highs. But the fact is that right now there appears to be one present and it seems to be evolving according to spec. However I am still skeptical that it will evolve successfully into a normal breakout.
The volume pattern seems to be confirming the pattern as well, at least somewhat. There was a nice surge in volume that accompanied the right portion of the head.
I have to admit with all the current political talk and debt ceiling talk, it is quite the amazing distraction for the market. If we analyze the news versus the tape, I think I have to say that the tape has held up quite well so far despite all the potential and the seriousness of the forthcoming news.
The tape over the last several months seems to have formed into a structure that could turn quite bearish.. and yet so far the tape in the recent month has for the most part held together.

So this pattern is just a ‘wait and see’. A break under 1313 would start to hurt this pattern and ruin the symmetry.