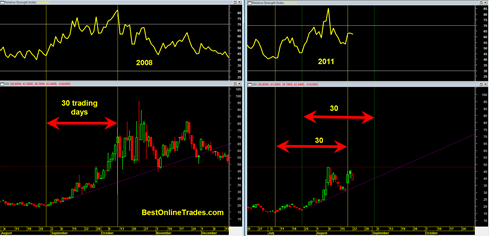
I was recently studying a possible correlation between the VIX volatility index behavior of 2008 mini crash and the current market correction to see if it can help identify how mature the current decline is relative to the 2008 period.
I have oft stated before that comparing previous portions of price action to present market action can be ‘junk science’. But I still do it because I like to try to get some sense of time duration of the current correction relative to previous ones. I think it is fair to say that the current market decline should be considered to be in the ‘same league’ as the 2008 decline. In fact some might argue this one is worse in terms of speed and magnitude so far.
In my opinion the worst of the 2008 decline was over with by October 10, 2008. While it is true that the sp500 went markedly lower than that afterwards, it was only able to do so after a serious of violent up and down reaction moves that got awfully messy and probably very difficult for anyone to trade. The fact is that the decline in to Oct 10, 2008 was the ‘easiest’ portion of the decline because of its persistence… The battles after that were complicated and difficult.
I was able to determine that the major portion of the 2008 decline as analyzed by the VIX was 30 trading days.
So I counted forward 30 trading days from the current volatility spike as measured by the VIX and I get a target date of September 2, 2011 as being the end of max decline portion.
The subjective part comes in when I try to determine the exact start date for the 2011 decline. From the right portion of the chart above if I use the first 30 day trading period then it suggests we have already seen the worst of the decline and could get into nasty whipsaw territory very soon.
But if I use the later 30 day period for the 2011 time frame then it shows that we should go into max decline portion by September 2, 2011.
The 48.20 level remains a key level in the VIX that needs to be achieved pretty soon by the market so launch the decline into OVERDRIVE. The longer it takes or the more it hesitates to do so in the days ahead, the more risk there is that we may have already seen the worst.
My current take is that we have not seen the worst yet. But I really want to see the VIX spring up again and hug that 48 line and try to jump it SOON.
After going over the VIX I happened to stumble upon this twitter posting by someone who appears to “exploits the mathematics of nature to decipher financial market behavior”. He states “Grid warns of 1000 point intra/inter-day panic in Dow Jones into Sept 2”. So I thought that was somewhat interesting that he comes up with the same date as my possible projection.
So we are basically talking about 9 more trading days… which incidentally would almost perfectly match the duration of the first leg down before we had this recent pause…

