
The sp500 is still trading in a bearish flag structure. Volume has been light recently and the ‘market head games’ continue. The market still looks extremely bearish to me and I see no reason to say we are at bottom now.
My attempt at the BOT long signal last week clearly failed. The market tried to trick me into thinking we had hit bottom. The chart in particular that was confusing me was the Nasdaq 100 index. It was clear to see that the August 9th, 2011 low was a retest of the very large inverse head and shoulders bottoming formation and it started to conjure up all sorts of bullish scenarios from a technical standpoint.
But the reality is that the monthlies are still bearish, the weeklies are bearish and the dailies are likely to roll over bearish again soon. So ‘stay the course bearish’ appears to be the correct call going forward.
I am noticing again probably for the umpteenth time that we have a 1987 crash pattern signature possibly at work. Once again I have to state that every single time in the past I have noticed this similarity it has not resulted in the expected outcome. Will this time be different ? A stock market crash is always a very improbable outcome because of the extreme rarity. In addition it just seems to obvious right now. In 1987 no one expected it and it came out of the blue. Now it seems like bearishness is obvious everywhere especially news wise.

Chart above shows left side 1987 and right side 2011 sp500. Note the first sharp leg down that created the pattern. The magnitude was quite different from the 2011 period as compared to 1987 period.
The seasonality is different as well with an offset of about 1 full month. The initial –8.6% leg down in 1987 ended on September 8th, 1987 (right before the W bottom was formed). The current period 2011 shows the initial leg down ended on August 8th, 2011.
AFTER THAT INITIAL BOTTOM THE MARKET RALLIED IN ‘W’ BOTTOM FORMATION for ABOUT 1 FULL CALENDAR MONTH BEFORE THE REAL FIREWORKS BEGAN.
For example in the 1987 period it rallied in flag formation or W bottom formation for 1 FULL MONTH (from the initial September 8th, 1987 low) until about October 8th, 1987 before the CRASH.
In the present time frame the market has managed to CONFUSE and DISTRACT also for about 1 FULL MONTH. Again, the initial bottom was August 8th, 2011. Presently we find ourselves at September 6th, 2011.
So if history is any guide, then it would suggest that we are only a couple or a few days away from the initiation of one of the greatest stock market crashes in all recorded history. September 8th, 2011 would fall on this Thursday.
I have to dig into TA of stocks and commodities Edwards and Magee book to see if there is an expected duration for typical bear flags.

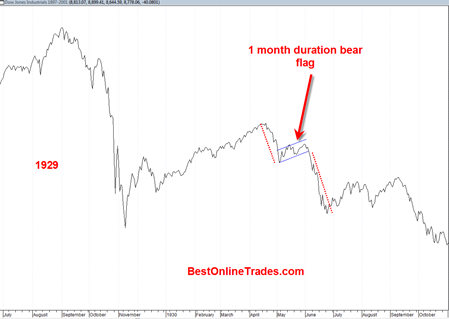
Note in the chart above I show the 1929 1930 period. There was also a bear flag that formed on a similar 1 month duration time frame.
The BOTTOM LINE:
Bear flags are very DECEPTIVE and CONFUSING patterns whose purpose is to confuse both bulls and bears and try to shake the tree as much as possible before the REAL drop.