
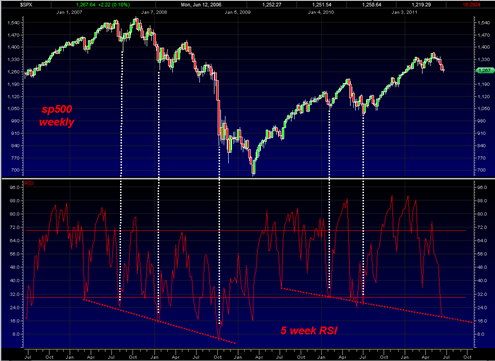
Someone emailed me a chart of the sp500 against the 5 week RSI indicating that it looked very oversold. I decided to investigate and looked over the chart myself. I find myself coming to the same conclusion.
I do not think I have ever focused on the 5 week RSI for timing but it seems to be making a case for a bounce from here on the weekly basis.
Of course 5 week RSI can always get more oversold into ‘extremely oversold’ range. It is a matter of probabilities. But the current 5 week RSI reading is showing that the market is the same oversold condition as was the case only 3 other times going back to early 2008.
If we are going to get more oversold on the 5 week RSI from here then it would start to challenge the oversold level that occurred during October of 2008 which was an extreme record and major outlier.

I drew a slanting down support line on the 5 week RSI portion of the chart above and it does seem to be in a supportive range.
Also if you look very carefully at the period of October 2007 which was the major all time peak in the market. We can see that the first decline portion was about 7 weeks and then a 2 to 3 week bounce occurred.
Currently we have also declined about 7 weeks and so if the pattern repeats then we could expect to see a 2 to 3 week bounce.
But it was AFTER that first small bounce after October 2007 that it became clear the market was going into deeper bear market territory.
Perhaps that is the ultimate test that awaits us now… a 2 to 3 week rally from here, and then a very important decision the market has to make if it wants to do an A B C down or continue to tread higher again.