
The XAU Gold and Silver Mining stock index has a reputation for being extremely volatile and choppy. It is a slow moving beast and is also represented by the GDX Market Vectors Gold Miners ETF.
Mining stocks and mining stock indices remind me of biotech stocks because they both seem to trade very erratically with a few exceptions and are definitely a swing traders paradise. In fact they are probably best suited for swing trading.
The long term XAU Mining Stock Index chart going all the way back to 1984 is quite a beautiful looking long term chart. It shows that the XAU has managed to break out northward from a 20+ year sideways trading range.
In 2008 it broke down back inside this trading range but then fully recovered and now is once again in breakout territory outside of this large trading range.
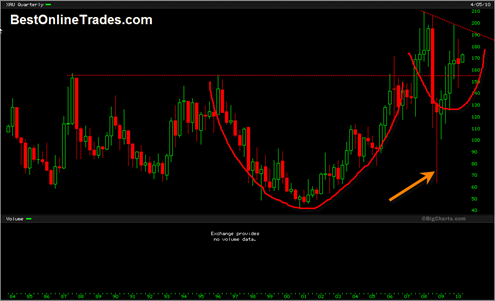
The chart shown here is the quarterly candlestick chart and one of the most amazing candles I have ever seen is the quarterly reversal hammer candle in the XAU Index. That candle is probably the most meaningful candle I have ever seen, and even more so because this is a quarterly candle chart.

The cup and handle tendency of this chart seems to suggest that another extended type breakout move is coming, but only if and when the XAU can trade above 200. If it gets above 200 then I believe it will be on high alert for a huge potential final blowoff move.
The volatility of 2008 in just 2 quarters says to me that this index has the potential to make huge moves. If it can retrace an almost 8 year bull market in only two quarters, then I don’t see why it can’t play catch up to the gold price in two quarters as well. But first it really needs to get above 200 before we can say anything serious is about to happen.
The cup and handle tendency is actually somewhat sloppy. The handle retraced far too much of the up portion of the chart even though it was an intra-quarter type retracement on the quarterly candlesticks.
This ‘pseudo handle’ itself right now looks like a large head and shoulders bottom formation with a very deep head portion. It seems unusual for a head and shoulders bottoming formation to form at such a high point in the overall trend and to me is a little bit suspect.
But still, as long as price can hold above the breakout area and somehow manage to get a move going above 200, then it will be an all green signal for this index. But for now it still has some work to do…
If this index really does fulfill the measurement implications of not only the head and shoulders bottom but also the larger cup and handle, then it would seem that a massive inflationary bout is coming down the road… perhaps sooner than we are prepared for.