You might have to start calling me ‘flip flop Tom’ or something similar but I gotta tell you the recent action is not too encouraging from a near term perspective at least based on price and volume.
Yes it is true that I don’t believe the real correction will get under way until we break the long term up trendline from the March lows.
But at the same time I guess I still want to try to be a hero and see if I can identify the top early like everyone else. This is sort of the exact opposite of what I was saying yesterday. But the charts do not lie and the volumes do not lie.
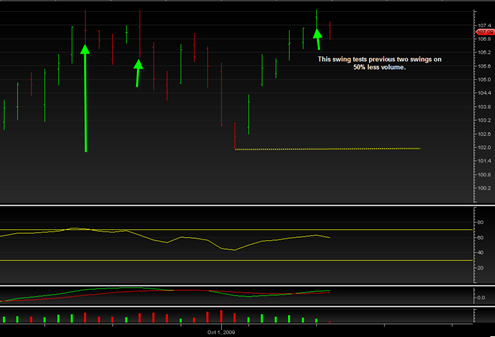
Anyway, here is what I am referring to:
The price swing of yesterday was a really weak price swing in terms of volume on the SPY, only 117 million shares. This is EXTREMELY weak and it tested the two previous swings as indicated by the green arrows. The volume is 50% less than those swings and price ALSO closed under those swing highs so that is a classic short term sell signal in terms of price and volume. I just cannot deny it. And this failure at these highs implies a move in the SPY back down to 101.99 near the yellow dotted line in the chart.
So you notice I am changing my mind all over the place lately. I think that is characteristic of market action near turning points. Because you get mixed signals and frequently changing signals.
But I wanted to get this important near term signal out to you. Again the price and volume do not lie and on a near term basis that is what it is saying to me and needs to be respected.
Also, and amazingly the original RSI pattern that I saw that identified the top in 1975 is almost IDENTICAL to the RSI pattern right now in the SP500 and if true then it means this is the final top before the 15% or so correction.
Sorry for the flip flopping, but I just want to communicate my read of the market on all levels, shorter term and longer term as they come up!

