
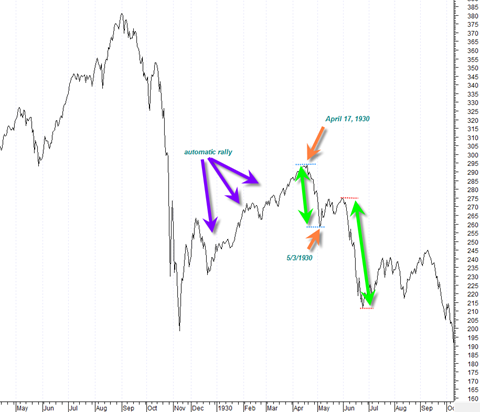
I thought it interesting that the price breakdown from the 1930’s automatic rally began on almost the same date as our current break down in Mid April. Also the first leg down was about –12% and that matches our break down into May 6, 2010.
The second major leg was a –23% drop. Note also the nice round beginning decade number of 1930 and 2010. I am not sure what to make the the similarity in the dates of the breakdowns, perhaps there are some cycles that attach the 1930’s peak with the 2010 peak.
I think the most interesting thing about the price action that occurred after the automatic rally ended in 1930 was the the subsequent price drop was not really a crash it was just like a boulder tumbling down the mountain with a few small pauses but eventually getting to its final destination.
I really am not sure what is worse. A quick sudden multi day drop or a drop that is spread out over 10 to 15 days. The drop that is spread out over time would maybe seem less worse since it is less sudden and would seem like normal corrective action to those who do not look at price charts.

Note that after the market bottomed out in June July Time frame it bounced around but then proceeded to get hit bad again during the seasonally weak September time frame.
So we could be dealing with a market that is much lower than is even imaginable by the end of this year. The tricky part is that it will seem to be happening in slow motion which will probably keep many people buying dips always thinking it is the final low.