
So far the action to start the very early part of this week looks very bearish to me. I really think this is the week that we finally start to see some very significant bearish follow through for a change. The S&P 500 futures were typically trading higher Sunday night and then into Monday morning. But so far the early morning bounce seems to have faded quite a bit. There is a steadily climbing mountain of evidence that suggests downward price momentum should increase the next 1 to 3 weeks and in particular this week.
Today I see that AAPL has (so far) bearishly engulfed last Friday’s gravestone doji and may finally get a break down from its large trading range. GE has also bearishly engulfed last Friday’s candlestick (so far) and is currently trading below the May 6, 2010 flash crash intra day low.
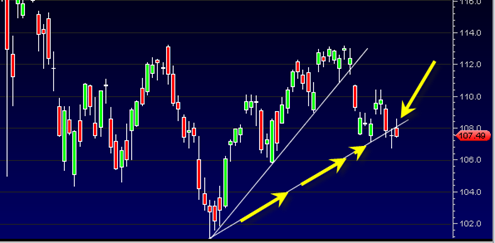
I would really like to see the SPY ETF get down near 106.75 to end the day today as it would strongly confirm the daily MACD histogram sell I was referring to last week.
The one nagging factor that makes me nervous about being ‘all in’ bearish is the lack of heavy volume today. The week is just starting off and the big money is headed for the beach. I am going to become a lot less concerned about volume if we can manage a daily MACD histogram sell confirmed signal today and some real weakness into end of day.
I see the 25th to 26th of August this week either serving as a massive acceleration point down for the market or possible low. It is looking like the 26th will be an acceleration point instead of a low right now. It is impossible to figure out until we see how the market looks going into the end of the week. The speed of price action will be the determining factor.

I really do not want to see any price action trading above 108.25 on the SPY ETF this week. If you look at the chart above you can see why. I want price to stay ‘broken’ under the up trend line shown by the yellow arrows. If this week is destined to be a hard down week, then there is absolutely no excuse for prices to be trading above this up trend line again.
Note: The above portion was written near mid day. The below portion was written at the close.
I am quite pleased with the bearish closing action today. The risk today was that some of the reversal hammers shown on a few indices would be confirmed as bullish today. This was not the case. Instead what I see at the close is bearish continuation and bearish engulfing showing that the bears want to exert some more control as we get into this week.
We could be in for 2 really wild down weeks with a possible massive acceleration or epicenter of the decline either mid week or Thursday of this week.
AAPL looks extremely bearish into the close (with the exception of relatively light volume). The bulls will say that every time AAPL has traded at the bottom of this very long trading range a strong bid came in and supported it back to the top of range again. This is true, but my current read of both the daily and weekly chart shows that this time we will get a breakdown that lasts.
I also see at the close today that we have a confirmed daily MACD histogram sell in the sp500. We needed to close under 1070.66 today to get that confirmation and we did get it with a close at 1067.36 today.
Tom
Thanks for your post. I also agree that AAPL looks interesting altho I am not “playing” it. Fundamentally, I just think there is way way too much high powered competition in the handheld space: Apple, Rim, Google, Nokia, and HP (with their purchase of Palm). All these are very deep pocketed players with very strong willed CEOs for admittedly a huge market, but the market has been 5 to 10 years being filled – – I just sense a real crunch coming in the space. Even Rim could apparently not come out with a category killer with its latest entrant – Torch.
I track the 10 day Moving Average of Arms Index / Trin and this Wednesday, I will replace the extremely high Arms reading of 6.25 with whatever happens on Wednesday. The 10 moving average currently stands at about 1.86. While it rarely happens, occasionally an extreme reading of 10 days prior allows for an equally or almost as extreme reading 10 trading days later. In any case, if Wednesday is a normal day with a Trin of about 1.00 than the 10 MA will plunge from 1.85 to 1.35 or so.
Investor sentiment, to my surprise was more bearish as reported in Barrons over the wkend. But I think am beginning to discount that sentiment because volumes are so low and because I sense that John Q Public is fed up with the market and the market is very much being manhandled by HFT.
Maybe the AAPL pipeline of new products for the next 12 months is non existent? Seems like they just upgraded everything and a few new products. So the price could settle in a little bit and meanwhile competition comes in as you indicate.
Sentimenttrader.com sentiment readings are neutral right now I think which is quite surprising given the context of trading setup right now…