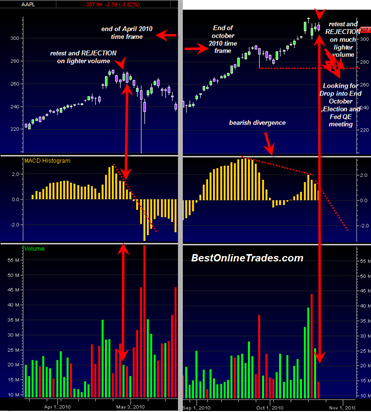
Apple Inc. AAPL is still showing what looks like a bearish divergence between MACD histogram and price. The current upside reactionary rally is pushing to higher highs on lower and lower volume and the juice is drying up. Today not only does it push to a higher high on much lower volume again, but it also closes below yesterday’s high.
It did this similar pattern formation way back in April 2010 near the top after the first big drop and then slight upside reactionary rally. After the reactionary rally was complete Apple Inc. went on to drop between 20 to 25% depending on whether or not you consider the extreme lows of the May 6, 2010 flash crash as valid price lows (I do). A 20% drop from current levels would put AAPL somewhere in the 250 range which would be well into its swing trading supportive range. I cannot speak at the moment to whether or not that type of price destruction is feasible. Just have to take it a day at a time.
The chart on the left shows AAPL in the 2020 April time frame and the current October time frame. The setup in terms of volume and price is somewhat similar.
The chart is saying to me that AAPL could easily get a drop down to 278 before it gets any kind of significant upside reaction.
The volume drying up on the current reaction and the close under yesterday’s highs is quite telling. Not to mention the bearish divergence.
A dramatic increase in sell volume in the next week or two would provide a lot more useful information on how potentially serious this top could be (or not).
One of the biggest gripes the bears have is that they need to see AAPL take some body blows before they can have any confidence about a real trend change. This chart seems to be saying that such a turn down is possible now from my read of the chart.


