
A very clever comment poster here at BestOnlineTrades named ‘JR’ has brought to my attention the AFFX price chart and I decided to take a closer look.
The longer term monthly candlestick chart of AFFX looks attractive enough to me for me to call it another ‘big pattern trade’. It appears BestOnlineTrades now has three choices for the next Big Pattern trade, HGSI, TLR and AFFX. It is currently unknown to me at this time which is the best big pattern trade of the bunch.
The nice thing about Big Pattern Trades is that generally speaking there is more time and flexibility to go long these types of trades since they usually evolve over the weekly and monthly basis.
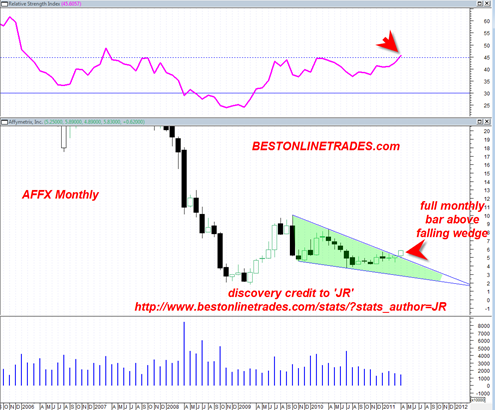
Anyway, AFFX appears to have broken out from a large falling monthly wedge pattern. Monthly RSI looks constructive and seems ready for a bullish move above the 50 percentile line.
The April candlestick breakout in AFFX was not on huge volume or wide price spread. This could be a short term concern, but the positive is that a full monthly price candlestick is trading above the falling wedge which should allow AFFX to start to trend higher from here.

I think this is a good setup and a nice big pattern type trade. But as I already mentioned I am not ready yet to compare it to the other two candidates TLR and HGSI.
When and if I exit the DBLE trade, I will try to make another assessment.
AFFX looks like it could be a multi month runner from here albeit an initially ‘slow runner’. It is common behavior for stocks to start their run slowly because confidence in the new uptrend is not with true conviction yet.
It should be noted that the monthly MACD histogram and quarterly MACD are also in a very bullish configuration.
Kudos to JR for this insight on AFFX.
Thanks Tom, for your comment, so far during this correction AFFX is holding up nicely. It closed above its recent trading range and the next test will $6.0
Of note is a similar bio, MNTA. As you know, I perk up when a stock creates a golden cross. This is not the absolute most important indicator but still it usually indicates a very positive trend. I love it when you see this chart action early in the game.
That said MNTA just crossed over and it has some really exceptional charts! With this stock potentially the sky could be the limit. It is interesting to look at MNTA’s fundamentals. It is nice when you find high flyers that not only have good technicals but in this case outstanding fundamentals.
One thing that is really interesting about MNTA is its wild swings. I haven’t figured that one out.
Would like to hear your comments on this volatility. How come?
I like these kind of stocks for your 30% gain idea.
Good hunting!
MNTA looks ok to me.. looks like it is coming back to support of uptrend that has a scalloping type pattern.. seems like it could continue to be a good long when it comes back to trend support… the volatility is probably typical for this or any type of biotech 🙂
Can you believe MNTA up 8.2% as of early Monaday afternoon. I couldn’t stay away from it during that crazy correction.
This is an amazing stock! Great fundamentals and incredible technicals. The shorts may have learned their lesson on this one. Which could be sounding an all clear.
This one should easily meet your 30% challenge.
Nice pick on MNTA JR. Looks like it is finding support on the up curving up trend line. Nice.
MNTA truly a WOW up 10.04% today. Lets see, if I could do that everyday! LOL
KERX is another bio that just had a golden cross. In at 4.58