It is looking like AMD is shaping up into a really good position trade into end 2013. AMD has been around the block a few times. This is no penny stock although it trades for 4 dollars and change right now. It averages about 20 million shares a day and my price data on the company goes back to 1983. Certainly the semiconductor and computer industry was a whole lot different at that time then it is now !
AMD has shown huge swing trading ranges for extended periods of time as the shares move in and out of favor.
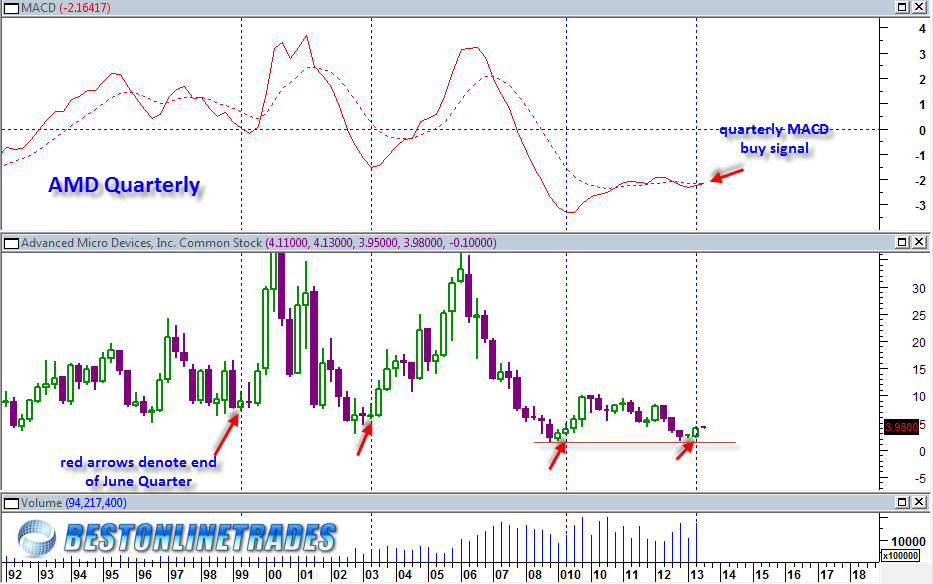
Looking at the long term QUARTERLY candlestick chart of AMD:

We see from the small red arrows that AMD has had a tendency at the quarter ending in JUNE to start a multi month and multi quarter substantial rally. This has been the case in each of the previous 3 major swing trading range turning points and was also the case in the 1996 time frame even though I forgot to put a red arrow there.
So now we finish the June quarter in 2013 and we see that the monthly MACD and quarterly MACD are turned north. In addition as of today’s price action we have the daily MACD in a bullish crossover stance. The weekly is also in a bullish crossover stance.
This evidence makes AMD a very attractive position trade (next 3 to 6 months) for the second half of 2013. Note also the large spaced apart double bottom between 2009 and 2013. This is a massive double bottom and we do see the recent rally off the bottom is coming in with well above average volume.
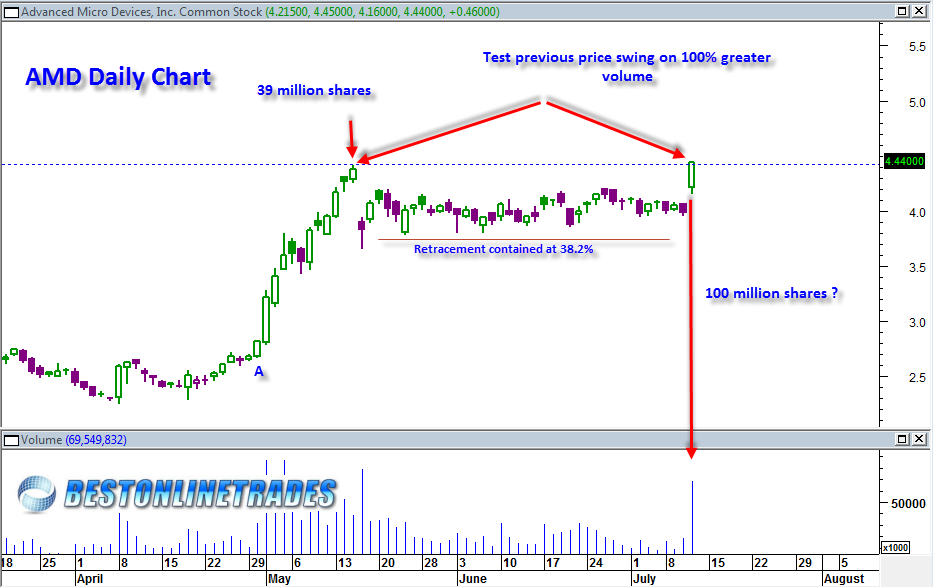
Now focusing in on the daily candlestick price chart:

Note the daily candlestick chart shows the HUGE rally in early May 2013 on massive volume well above average. Then since mid May AMD has done a price retracement that was contained to only 38.2% Fibonacci level. This is a very bullish sign and symptomatic of inherent bullish strength in the stock.
Today we see that AMD does an attack on the previous swing high May 15th, 2013. The May 15th, 2013 swing high was on 39 million shares. Today we are probably close to a 100 million share day and we did exceed that previous high. So we have done a test of that previous swing on 100% greater volume which is an extremely bullish sign and indicative indicator that AMD will exceed the 4.42 price level in bullish fashion.
AMD is still a quite volatile stock despite its massive size.
AMD has earnings coming out July 18th, 2013 (needs verification) so there could be a price run up into earnings date. It is never recommended to hold any stock through an earnings date although current broker upgrades and technicals seem to suggest they will come out ok and positive.
Assuming a valid breakout above 4.42 occurs, then it would not be uncommon to see a price retest of the 4.42 level. This level must hold in constructive fashion to give AMD a green light for a trending move towards 5 and possibly much higher.
