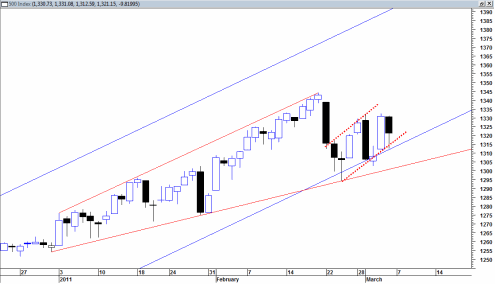
Today seemed like a bi polar day in the markets. The market was up down and all around trying to figure out what the jobs report means. Had we closed at the lows today then we would have fully engulfed yesterday’s candlestick and potentially created a bearish scenario for next week. We would also have started to create a similar looking situation to the April 2010 topping formation where we saw violent up rallies that were fully retraced down the next day. That happened several times in end of April 2010 before the market fell apart.
This higher volatility and next day full retracement of a previous day’s surge higher could be a hint of more downside volatility to come.
But still, when I look at the zoomed in price action of the sp500 I see that we are still holding the channel supporting line (bottom solid blue line) and today we tested it again and rejected it by end of day. We are also still trading within the broadening wedge pattern.
So trading discipline and tape reading suggests that we are still in constructive form and could press higher next week. We are still creating higher lows after the recent mini correction.
I have to be careful about pre judging the market before it shows its hand.
The Russell 2000 today was notable strong and only ended up down about a half a percent. It could be that we are going through a distribution phase in the market were large caps take a corrective hit for a while longer while small caps lead higher for a bit.
Volume was notably quite heavy on the SPY ETF today and could hint that we are about to start a B to C leg down of an A B C down type move. But gain, I have to revert to the fact that we are still holding channel support today and making higher lows. This point precedes my other theories in terms of relevance.
Given the high volume today and the relative lack of a major down move, one could also theorize that there was absorption of any new potential bearish trend today.
There is not much room between where we are now in the sp500 and the bottom channel boundary and the bottom boundary of the broadening wedge formation (solid red lines). A simple hard down close early next week could easily set in motion a deeper correction and start to violate some of these near term support channels.
Finally one could make the case that we are trading in a rising bearish flag formation. These formations usually get a follow on down move that is near equivalent to the one that started the formation.
I wish I could speak with more conviction about the markets next move, but I am finding enough contradictions to the point that it is almost a coin toss at this point…

