
I wrote about the Russell 2000 Index a few days ago and at the time I was writing about it the Russell 2000 looked like it was going to print quite a strong looking reversal hammer by the end of the day. As it turns out the final candlestick was not a reversal hammer at all. It was instead just a somewhat smallish looking doji candlestick.
I am not sure if my data provider was feeding bad data or what the exact problem was, because it was showing me that the Russell 2000 candlestick had a long bottoming tail similar to previous key reversal points in this index.
It is a very important difference because the smallish looking doji we printed on this past Thursday 8/12/2010 can now be simply interpreted as a minor pause in the previous down trend and the half way move towards the bottom of an important channel that this index trades in. See the chart below for clarity.

In addition to the recent doji it can clearly be seen that the candlestick the day before was a sign of weakness that broke the uptrend in force since July 1, 2010.
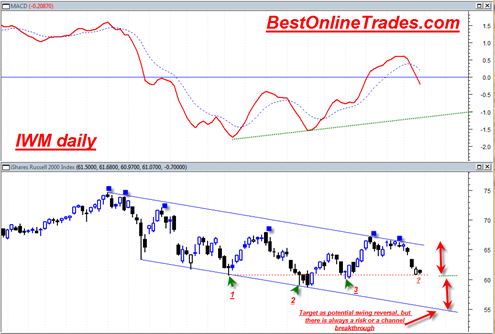
If we look at the chart of the iShares Russell 2000 Index (ETF) (Public, NYSE:IWM) in the slightly larger time frame a more clearly defined picture starts to emerge.
First lets start with a simple truth about the IWM trading pattern since the April 2010 top. It can clearly be seen that the IWM has attempted to rally to a higher high during this entire downward trending trading channel but has each time failed (see the blue solid squares). It has attempted to trade to a higher high 5 separate times but has failed each time. In the two most recent attempts it failed again and made a small double top, and the second top that created the top also was not able to trade to a higher high.
So to sum up we have the IWM trading in a bearish down trending channel that fails to make a higher peak at any time throughout the channel and has most recently broken down quite quickly from a small double top right before the most bearish seasonal time frame for the market.

Also if you look at the green arrows you can see previous reversal hammer candlesticks that were quite effective in blasting the IWM higher as strong reversal points. The first one occurred when MACD was deeply oversold and near channel support. The second green arrow was near a point where the MACD was in selling mode but was at an upchannel support from the previous sell off. The third green arrow shows the hammer candlestick reversal where the MACD was in bullish buy mode. So each of these three hammer reversal candlesticks led the IWM higher.
But what do we have now ???
- During the last two days we do not have a reversal hammer candlestick.
- We have the MACD in sell mode at an early phase and also no where near the previous supporting channel of the previous two bottoms (number 1 and 2). We also have the MACD just crossing over down through the zero line.
So the above two bullet points alone could be reason enough why the IWM is at a half way point of its decline. There is no hammer reversal.
I would say that if the IWM is going to reverse up from here it needs to start doing it right from the get go this Monday. But even if it does that it must still contend with the power of this down trending channel that to present date has not been able to produce a higher high valley. So a rally on mutual fund Monday could set the IWM slightly higher, but then it may fail again at down channel resistance.
Also important is that the two most recent candlesticks low value of 60.76 never reached the low value of the hammer reversal market with the green arrow number 1. This is important going into a 2 day weekend because sometimes 2 day weekends or 3 day weekends for the matter can be a source of a building up of energy for a gap down to start the new week.
The red dotted horizontal line is the KEY level that must hold in the IWM otherwise this one is going to trade back to the downward portion of this channel which at the time of this post is my forecast.
I put a note up in the chart that the target at the bottom of the channel is the likely stopping point, but every time price gets to the top or bottom of any price channel there is always the risk that price will BUST through and create a dramatic increase in momentum in the current direction.
Price has a tendency to stay within a channel, but channels can and do get broken and create new stronger price moves in the current trend direction which happens to be down.
Here in mid August, it seems like we are starting to build quite a strong bearish forecast. If the red dotted horizontal line is busted to the downside early this week, it is going to kick in some more bearish momentum. Even if it does not, there is still the bearish downward trending channel bias.
The seasonal time frame of mid August is very bearish time for the market going into September.
At the end point of this article I have almost talked myself into the possibility that this market may CRASH again. Mutual fund Monday with the futures up +14 points seems to have been the typical pattern for what seems like ages now. If that is not this case this Sunday night and Monday morning then look out below.
I also just recently reviewed the WEEKLY price chart of the IWM and I can see from this vantage point that the WEEKLY macd bullish cross that was supposed to happen last week has failed and instead created a bearish weekly MACD kiss and moved the weekly macd into a stance of crossing below the zero line. Very bearish.
Someone emailed me late last week and mentioned that there is also a pseudo looking island top in many if not most indices. This island top would be from 8/2/2010 to 8/10/2010. It is pseudo island top because they are ideally formed if more isolated up in the air instead of contained within price congestion.
Still, I can tell you that island tops in the commodity markets are one of the most bearish patterns in existence and never to be taken lightly. Strangely enough the current stock markets have been acting to a degree just like commodities in my opinion.
So, with that big mouthful.. here is my bottom line..
As long as the red dotted trendline in the chart above holds then I at least remain open to being slightly constructive on the market in the very short term (1 to 3 or 4 days). If the market can bounce higher early this week then it gives the market a shot from the IWM chart a chance at making a right shoulder of a head and shoulders bottoming formation. But this pattern will only succeed if price heads higher straight out of the gate this week and curls up and then busts higher above 65.
But the preponderance of evidence is that we will not be able to get that upward momentum based on the weekly charts. The evidence suggests that we are going to bust down below the red dotted trendline and start to create further downward momentum.
If we do bust the red dotted support horizontal support line ( I suspect we will soon) then the speed of downward price movement will be important to watch as a possible risk factor for breaking under the channel support line.
It is looking like we are building a setup for a nasty September climax sell off. September is not good for the paper equity markets in general. I can see early downward momentum building into climax bottom in September.
I also believe that if this more bearish scenario plays out we may see a complete inverse move in the gold price (much higher) and possibly also the mining shares. A heavy decline in paper equities during the next 1.5 months could blast the gold price dramatically higher to new all time highs on a “weak growth or stagnating paper equity growth scenario”. I don’t want to stick my neck out too far ( I think I already have anyway) but this September may see the biggest gold moves to date especially if the gold market can find a way to feed off of paper equity market weakness.
The weekly MACD histogram did get a confirmed buy signal in the gold market last week. Gold is set up to be bullish going into September and paper equities are set up to be weaker, possibly dramatically weaker. Gold looks like it wants to ‘jump the creek’ higher this week possibly in dramatic fashion. Worth watching very closely.
The weekly chart in the IWM is what really got me extra bearish this weekend. The weekly trend has reasserted itself strongly in the downward direction again after the previous two weeks showing weekly doji reversals right at bearish channel down trending resistance…
Tom
I like your CC quote at the end. I am with you on a down market, against you on an up gold mining stocks (I think gold stocks will get hammered along with everything else – – but gold itself will be a relative outperformer).
Only problem I see is a lot of publicity, including in WSJ over wkend of this Hindenburg Omen. The US Treasury could potentially manipulate the market in the short term by buying massive quantities of S & P futures – – heck I do not know if that is in their tool kit – – but if it is, this Administration would definitely do it.
Tom
After 250 pt drop on Wednesday last week, I thought investor sentiment readings would have moved a lot more bearish. Surprised!
According to Barrrons 16-August issue, the AAll Index went from 30.4% bullish the week before to 39.8% bullish this week! The bearish component fell by a corresponding amount! The other indicators were on either side of unchanged. My take is that this market has further to fall.
Caveat: I have been told that readings are taken early in the week, but market had dropped 200+ points by about noon on Wednesday. I had thought that pessimism was very thick, but again, I was wrong.
Potentially good for bears
What do you think of HPQ? Chart looks oversold and it’s about to reverse from the current downtrend triggered by the CEO outster. HP reports earning next Thursday and I think they will beat. Nov $40 calls is less than $3 has the potential to jump 100% in the next couple of weeks.