
The sp500 today barely made much ground but still held recent levels which in my opinion should be treated as a bullish sign, especially after the shooting star reversal of 2 days ago.
The long side continues to look like the right side to me and I do not expect to change my opinion for quite some time. Of course there will be pull backs and corrections but the key issue is where is the much larger trend in the sp500 heading ??
Probably the biggest money in the markets are made by those who are able to have the foresight into the much larger trends and the biggest portions of market action. I am not necessarily talking 5 or 10 years. I am talking about 6 month or 1 year chunks of market action.
The next 6 months to 1 year chunk of market action looks to be quite clearly in the up direction from my read of the charts. There is very little doubt about that in my mind now. Of course as always my opinion is subject to change at any time, but as of 12/9/2010 at 8:13PM Eastern Time USA, that stands as my opinion.
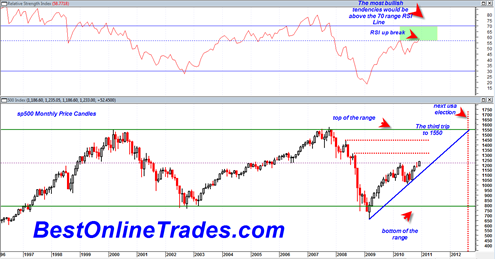
If we look again at the long term monthly chart of the sp500 we can clearly see this very large swing trading range between 600 –800 in the sp500 and 1500. This is such a huge swing trading range that I think it is fair to call the moves within this range as mini bull and bear markets. It is truly quite fascinating.

The recent upwards break we have seen in the sp500 and other indices implies to me that the sp500 is destined for 1550 again. Why? One of the reasons why is the simple premise that if a stock or market fails to take out the previous swing trading lows of the range, then it will turn around and try to take out the previous swing highs of the range. In this case the previous swing highs of the large range are 1550. To a certain degree the market is just an oscillating mechanism that tries to bust out of previous ranges. If it cannot succeed on one side, then it will turn around and attempt the other side.
So without looking at any other indicators, volume, or other mumbo jumbo, I can say very simply that this market wants to trade back up to the old highs of the range near 1550 again, perhaps by end of 2011 or early 2012.
I have written before that I thought we would advance in the sp500 to 1300 to 1400 but then start to stall because of the inflation picture changing that would begin to act like a ‘tax’ on the market and its upside progress. This is total speculation at this point. I am not an economist and do not know enough about inflationary trends or history to say with confidence that it could accelerate so quickly within the next 1 to 2 years. So for now that is just a speculation.
It is probably best to leave that speculation aside for now and just go with the presumption that this market is gearing up for a run back to 1550.
So it probably goes without saying that long trades will be the best way to go and to look for new entries on pull backs.
The chart above shows that monthly RSI is breaking north past previous resistance of the April level. The most bullish possible environment would be for monthly RSI to break above the 70 range.
It is interesting that the up trend line since the March 2009 lows finds a termination point near the 2012 USA presidential election. Pure coincidence ? 🙂
This is a very large and powerful range and I am most curious assuming we do get up to 1550, whether or not we would be able to BREAK OUT north of 1550 and start a totally new mega bull after that.
My first intuition is that we will not be able to break 1550. But then my second intuition is that this would be the 3rd trip up to this level and usually markets are able to succeed on 3rd try attempts.
If we look at the 1970 time frame we see that the market went sideways in a very large swing trading range for 16 to 17 years and had to make 5 full attempts at the top of the range before it was able to break through it on the 6th attempt.
So maybe we need 3 more attempts and another 6 or 7 years before we ever get a break through of 1550 🙂
You could just as easily call it a double-top from your long term chart. So the jury- in my opinion- is out. That is why it is churning, since it cannot decide if this point is double-top or just a bump in the road.
Good point Steve. I had not thought of it from that perspective but its true. A double top by definition creates a picture of doubt and would seem to explain the lack of recent conviction.
On the other hand the selling pressure at current levels which normally would lead to confirmed double top seems to be getting absorbed currently.
There appears to be a rising wedge on the SPY and GLD. But still looking for the market to go up to the top of wedge. If the dollar is going to rise in tandem then the small caps (IWM) would be the best bet since they are not the exporters that the DJI and SPX are