
Today was a clear confirmation to me that we have switched from the massive bullish trend since late August 2010 to a beginning bearish trend. In yesterday’s post I pointed out the double inside day 3 day price pattern in the sp500 and said it would lead to a huge move either up or down. Today it was clearly down, closed at the lows and also had more than enough volume to go with it.
I think we could get some type of upward bounce tomorrow on some positive consumer confidence numbers but then maybe a sell off near the close.
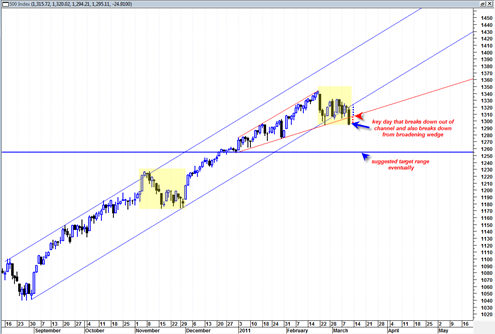
A bounce higher tomorrow could reach two possible levels. One level corresponds with the underside of the broadening wedge formation I have been talking about now for quite some time. The other level corresponds to the underside of the up channel we just broke down through.
My preferred choice is that we bounce to the underside of the broadening wedge and then get stuck there for a while and then fail at the end of day.
The much more painful upside bounce level would be back to the underside of the channel we just broke down through. The reason why it would be more painful is because it would completely erase all of today’s short selling gains.

So again the preferred scenario is for an upward retracement to the point indicated by the red arrow in the chart of the sp500 above. I would look for any rally to run into a brick wall near those levels and gauge the market carefully from there.
The two yellow shaded areas are drawn in to show the uncanny similarity in terms of price pattern. Both of them look quite similar. But how similar are they really? They are actually quite different and here is why:
Both patterns look like a normal corrective process that is now finishing in the form of a double bottom. But the most recent formation which we are in now is ‘double bottoming’ with a huge sign of weakness candlestick that was on equal or greater volume than the 2/24/2011 and 2/23/2011 price low swings. I am using the SPY volume as the gauge. Today’s volume in the SPY was 300 million shares, significantly more than the 227 or 260 million of the other two swing lows of 2/23/2011 and 2/24/2011. To me that is a dead giveaway that the market will crack current levels. Whether it happens tomorrow or next week is a mute point, it looks quite probable for a crack down through today’s closing level.
The first pattern in November 2010 formed a finishing double bottom with a reversal hammer and then a doji hammer that was on dramatically lighter volume than the first price low swing of 11/15/2010. In addition the 2/24/2010 final low price swing still held channel support. Today’s move broke down through channel support.
I have a running theory now that a good portion of next week should be down with a possible ideal low setting up for either March 18, 2011 or March 21st, 2011 which would be right on the full moon and one of the closest full moons we have had to earth in a long time.
It is almost too perfect a scenario, but by that time the RSI should be near the 30 level and significantly oversold. Staying short after a week from tomorrow could be bad medicine since we already know the previous trend has been extremely powerful up. So it would not be unusual for the market to make an important low end of next week and then zoom all the way back up for miles (or kilometers) before resuming any down trend.
The summation index dove lower today and the percent of stocks above 50 day moving average continued its bearish tendencies. Also note that the RSI of the summation index busted down through the 50 percentile line which is a near term sign of significant more bearish price action (usually).
If there is a bounce tomorrow to the red arrow then it could potentially be a great re shorting opportunity.
Also today notably the US Dollar Index got a nice northward bounce and seems to be reacting nicely off of the long term 3 year support line I have talked about before. This is an important reversal in the dollar and again seems to support more equity weakness in the weeks ahead.
Hmmm. See my scenario of two days ago!
Nice call JR, but I think we go down into mid June 2011 now instead of up into June 2011
Well the Bradley Date of Feb 17 marked the beginning of the decline. June 15 is the next major turn date which would correlate to your time frame
Have a lot of other technical indicators that say were going down but I don’t know if the FED is going to let that happen and ruin every bodies 401k happy days
On that subject here is another take on the”coming rout”
“The basic idea is this: The Fed has been dumping roughly $4 billion of thin-air money into the US markets each trading day since November 2010. The markets, all of them, are higher than they would be without this money. $4 billion per trading day is an enormous amount of money”
http://www.chrismartenson.com/blog/coming-rout/53869
There is also a 60 min Triangle on the SPX that broke down Thursday. We may rally some but the trend is down
Read an article in my RSS that said the fund managers said anything south of 1295 was bear market for SPX. It closed right at that and held yesterday. Lookin at above 1300 at the moment but looks to be under the trend line. A 10% pullback should put SPX at about 1200 but I really dont see that happening and that would put it at about the 200 on yearly.
THINK: Technical analysis is designed to predict the way the market will perform in the future. It is actually a statistical tool.
In order for statistics to work you need a very large sample. You cannot predict the future with just one event as your model.
So technical analysis has relied on many past events that represented correlations that repeated in the future.
The bane of statisticians is and always will be the outliers. That is behavior that essentially destroys the normative aspect of your predictor.
Today, all of our technical/statistical predictors require a normative event. For example, the explosion of a nuclear device in N.Y. is an outlier and would negate any normative prediction based on technical analysis.
But today, we have another outlier and that is the Fed. As long as that outlier dominates the stock market, you simply cannot rely on normative technical analysis.
You need a new algorithm. Difficult since the action of the outlier is not predictable on a daily basis.
It is worth note that the hedge funds that rely on these algorithms have not been able to perform with the market. But on a day by day basis their presence in the market again distorts the outlier.
Leading technical analysis to reach the wrong conclusions.
That is why this market has been so difficult to play.
However that said you can rely on the Fed as an outlier to continue to pressure the market on the upside. Regardless of the normative predictors of technical analysis.
Looks like we bounced of the bottom of your broadening wedge at about 1308.
Yes indeed, but problem is it looks like we still have the opening gap to fill on the SPY and plus today we may have created a short term 2B buy signal and we engulfed a lot of yesterdays decline for a bullish piercing pattern…
so once again we will have to see if bears can break support next week…
But you are right, we did test bottom side of the broadening wedge…
Tom, which is more important? the volume by which the back testing is done or the chart pattern, engulfing candle.
That is a GREAT question. I was thinking the exact same thing after the close on this past Friday. I have encountered this type of contradiction many times in the past. I would say that the price itself and what it achieves or does not achieve is the more important deciding factor to make decisions on. So in this case I would have to say for example on the Nasdaq Composite, the bullish engulfing candle was quite a bullish event. However it would not be confirmed unless we get a close above this candlestick pattern early this up coming week.
I have to tell you the bullish engulfing that the Nasdaq Composite did was not supposed to happen on 3/11/2011. What I mean is that for the bear case to be strongly valid, it really should not have happened especially on a Friday. But it did. And one could make the case that a 2B buy signal has been created.
So once again we must contemplate whether or not we are not already dealing with the end of the decline already and will continue in trading range fashion, or perhaps a much more muted and small downward sloping type correction. If true, then it would not be so beneficial for any inverse ETFS who suffer decay anyway and would likely whipsaw short positions all over the place.
The bottom line of this market for a long time ( since September 2010) is that it has been able to jump through fire hoops, defuse detonating bombs and evade super bearish monthly, weekly and daily candlestick setups. So one really has to keep on guard that it may do it again and disappoint the bears.
But it is still true that the weekly MACD looks for a bearish crossover this week and the summation index is negative. Sometimes a bearish WEEKLY MACD crossover turns into a ‘fade buy’ signal where the actual negative crossover turns into a buy in strong markets!
If the market is able to hold the support level around this bullish engulfing pattern, then we are dealing with a different animal. It would be quite amazing if it is able to hold it and not go any lower than that…
I will try to do another update before the weekend is over to draw it up on the charts…
on Feb 2, you were “pounding the table for URRE” when it was about $3.24. Today it is selling at $1.70 – – – is this a time to buy?
Tom,
Looking at the chart above you hit hte target range pretty dead on. Sure didnt take that long to get there either. Looking at the weekly chart, this could be the end of the down cycle. Looks to be about an 8% cycle. Let’s see what happens form here. Hope they keep the Nikkie closed for a few days.
Yes I was pounding my fists on the table for URRE right until 2/15/2011 when it did that bearish engulfing. That bearish engulfing was the end of my love for URRE and since then it has totally collapsed.
Right now URRE is actually sitting right on a nice support zone of 1.4 (todays low), so I would say URRE is either today or very close to a buy now for a trade only for the upcoming AUTOMATIC Rally higher.
1.4 is the long term support range.
I say it is only a tradeable buy for the automatic rally that is to come because I just have no clue if this industry is dead now longer term. The recent decline was on massive volume and stocks are not supposed to test long term support on heavy volume like that.
So again, a possible tradeable buy (1 to a few days) right now or as long as holding 1.4 support range.
Holding a stock like this now going forward is likely to give major indigestion.
Yes I think we are getting close to the first bottom.. there should be a higher low forming soon perhaps by Friday this week right on the full moon..
I really don’t think we are close to the first bottom, perhaps a slight up tick. But I see deterioration everywhere.
In the averages but in a large array of stocks I follow,almost all of which are showing a bearish MACD.. This is a typical reading, First, the MACD is below the signal line, a 9-day moving average. Second, the MACD is below the critical level of 0, which implies that the underlying moving averages are trending lower.
Plus, it seems to me there are just too many negative outliers. We have the middle east turmoil and uncertainty a devastated Japan, the insanity that we can have guns and butter, the dithering of our President, Europe in disarray.
WOW! how much can a market shrug off!
The technicals for the S&P 500 are really bad but nothing compared with the NASDAQ.
What is there to love about this market? Unless of course you are a bear, which by the way I am!
I agree with you now JR. I think based on the tape action today and the sustaining of massive volume on the SPY that we are about to move into a panic low either this Friday or the Monday after the weekend. It should be an intra day panic type low on massive volume.