
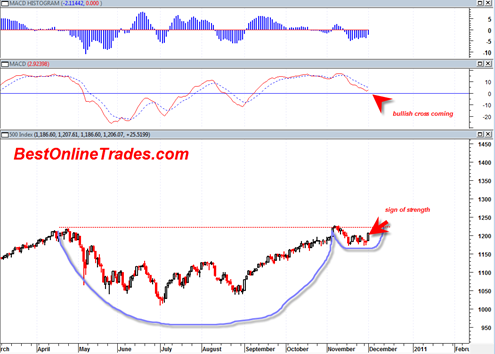
Today is the type of day in the market that almost needs no explanation because of the somewhat obvious signal being sent. Today was a clear sign of strength in the market and the closing candlestick was almost a marubozu candlestick which shows clear strength and a persistent close.
Today’s action seems to seal the case that we are now forming the right portion of the handle of a much large cup and handle pattern.
We continue to hear bad news out of Europe and the occasional rumblings out of North Korea and yet the market just keeps going higher and higher. I wonder why? At this point the message should be clear that the market does not care much at all about the sovereign debt problems in Europe or even the USA for that matter. In fact the sovereign debt problems may actually be a reason to move INTO stocks as opposed to out of them (according to Marty Armstrong anyway).
The cup and handle pattern I have been discussing for a while now appears to be ready to activate and should mean between 100 to 200 S&P points to the upside.

As far as I am concerned the correction we have seen for the last 3 weeks is over as of today.
The monthly November 2010 reversal hammer is clearly not showing any signs that it will be bearishly confirmed unless the market completely falls apart the rest of this week which looks unlikely. This monthly reversal hammer is starting to look like it will be a false signal and was merely a consolidation candle represented by previous sellers at the April 2010 highs.
So, back to the BOT long signal again as of 1201 in the sp500. I suspect that this BOT long signal is going to stay active for quite some time because of the potential magnitude and measurement implication of this pattern.
In truth I probably should never have switched away from the long signal that I issued way back in Early September 2010 because of the long term bullish prospects and my much earlier observations that the market trend is very strong because it only did a 38% retracement from the March 2009 lows. That is water under the bridge now, but I want fewer and cleaner signals and would like to stay with the trend as long as possible while at the same time avoiding trying to catch every 1 to 3% down move.
At this point I think it is fair to say that the Christmas 2010 rally has arrived. Buckle your seat belts…
I think we will meander our way back up to the previous high around 1225 on the SPX the rest of the week, but I see Monday as a possible reversal day.
Here is a multi sentiment indicator worth looking at:
http://www.tradersnarrative.com/ndr-crowd-sentiment-poll-at-april-2010-highs-5049.html
I think we have to figure out a more long term strategy of trading markets. We cannot be yanked in/out of the market on a daily basis. I am searching for that formula.. I hope you shed some light in future posts on that.
OMG…. Steve,
It was nice to read your post when you say
Quote “I think we have to figure out a more long term strategy of trading markets. We cannot be yanked in/out of the market on a daily basis. I am searching for that formula.. I hope you shed some light in future posts on that” Unquote.
I (along with world) am (are) searching for that formula for last 3 million years.. Sorry for cutting rude joke…But it is very very very difficult….
In answer to shrihas comment, I think the answer lies in an intermediate timing approach. Day trading for me is way to volatile, although occasionally when a play is obvious I do day trade.
Primarily, I look ahead a month or two. I have a few favorite technical indicators that for me have proven true over the decades. Various osilators are really helpful with your timing. Watch the RSI. However I do not put too much faith in any single indicator. Rather I use a basket, as has been obvious in my postings.
It is true that in the long run we are all dead. Forget about the long waves. Go with the flow, even if there looms a water fall in the distant future.
Finally and I cannot stress this enough, do not listen to the talking heads. Avoid being influenced by financial news.
Study your market moves and see where you have made your mistakes. Try not to make them again.
Do not become married to any position, EVER!!
That includes being too bearish or too bullish.
I have posted my thoughts, and as can be seen they have usually been quite accurate. I have posted my moves in particular stocks and as anyone can see, I have been making money, sometime lots of money on my plays.
So, it is obvious, I practice what I preach.
In summary, practice critical thinking! Don’t fight the tape (flow), follow the Fed. Since you are only thinking about the intermediate trend, take profits often!
Find a small basket of indicators that you can use to assist you in your decisions, but think critically. There is a lot of false information circulated. Like they say there are lies, damn lies and statistics. When you look at statistics, government indicators, etc, keep a critical eye, when they look bogus they usually are.
Definitely, do not become too bullish or too bearish. These are terms you should never become married to!
Hey Ed that is a nice sentiment chart. It seems like it can still zig zag for a while in the top zone sometimes like it did in late 2006. We might be in that type of phase right now.
Steve, I was actually thinking about that yesterday as well. And it occurred to me that one possible method by which one can trade on longer term is to only look at the market indices over the weekend and completely ignore it during the week. Essentially this would force you to trade the weekly charts instead of the daily charts. The daily swings can be very mind bending.
As long as key momentum and weekly oscillators are pointing up on the weeklies then the trend is your friend.
Of course this is easy to say in theory but forcing someone to only look at the market every weekend is not easy to do as the market tries to lure you in as much as possible.
But right now I would say that it is not too late to try a trend following strategy with the cup and handle pattern that we seem to be breaking out of.
Those are excellent points JR, thank you. The only other point I think I would add is to try to be as precise as possible in entry points and wait for very real and valid confirmation that the trade is ready to go your way. Markets have habit of taking their own sweet time and then only in the final hour deliver their real reversal signals after many long slow days of waiting…
Personally, I am working on strategies around bollinger bands and moving out of volatility squeeze. I think a squeezed play is less influenced by the general market direction (I think but not sure yet…) than a high momentum nose-bleed sky high stock.
A possible modification of JR’s, and one promoted by Alex Elder. First look at weekly chart to figure out general direction, never first look at daily.
Once you have your “direct bias”, look at the daily chart and trade the daily only with the weekly bias.
In this model, one can be more active than being a weekend trader, but still go with the intermediate trend.
Worden has seminar archives, look at the one with Dr. Elder.
Thanks for the comments. I think this is an excellent way to learn from the experiences of others.
Thanks Steve
How about others offering their best choice for an indicator?
Or even their personal choice for the way they have made the most money this year?
Or the maxim that has helped them the most?
Yeah–SAY IT!!