
I think evidence is starting to pile up that the weekly sell signal given in early March 2011 is now starting to re establish itself. There is a confirmed weekly MACD sell signal based on the MACD weekly histogram today, but we are only two days into the week. This signal can still reverse itself during the next 3 trading days. If it does not then of course the weekly confirmed sell will remain intact.
The downside volume in the SPY was actually quite average today and I am not quite sure whether to interpret this as complacency or a sign of a weak bearish attempt.
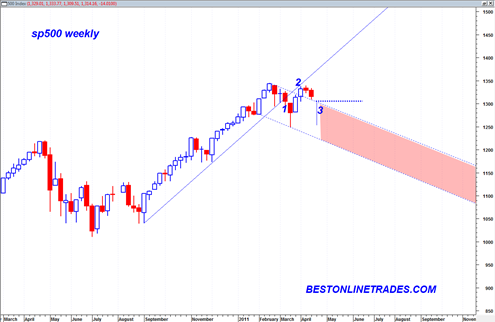
The advance since the 3/16/2011 high volume swing low appears to be a rising wedge formation that has pressed back up to the old highs. Up at the old highs we recently saw several doji candlesticks which marked an indecision point. Now the market has turned down again, although not to an extreme.

Looking at the weekly chart we can see that the weekly up trend was broken with high volume at (1). Then we had the two to three week upwards rally back under the up trend line to (2) forming several daily doji candlesticks. But now so far this week we are retracing down a bit and today we touched the top of this large declining channel.
Important to point out is that we busted above this declining channel and now seem to be testing the top of the channel on a retracement. A bullish interpretation would be that we broke out north of the declining channel are are now simply doing a retest of the top of the channel.
We need to break below the horizontal blue dotted line either this week or next week to get prices back into the declining channel and into a more significant bearish stance again.
I think we have a good shot at doing just that.
If the price move from the 3/16/2011 up to the present time frame really is a rising wedge, then there exists the possibility of a rapid price decline out of that pattern. Sometimes that is the nature of rising wedges. The target would be the low of the wedge or about 1250 on the sp500.
Other indices seem to be confirming the advent of more bearish price action on the sp500. For example the XLF double topped near 2/17/2011 on low volume and now is now in down trend mode. It has a price pattern that resembles a large rising flag. Daily MACD has attempted to break out north of the zero line but now appears to be failing with a possible bearish crossover under the zero line again. That is not bullish action. Incidentally the same type of trading dynamic is occurring in AAPL right now as well which is quite unusual for that stock.
So I am seeing a good small handful of early signs that we are about to resume the weekly bearish trend…, but I think the market still has to figure that out the rest of this week.