
Someone asked me some time ago whether or not BRKR was a good buy or not on August 4, 2010. I wrote up a post on it and indicated that it was probably due for some type of pull back first that would maybe create a cup and handle formation.
As it turns out Bruker Corporation has obliged and done something similar. It looks like it has a head and shoulders bottom formation that has a price projection to new all time highs.
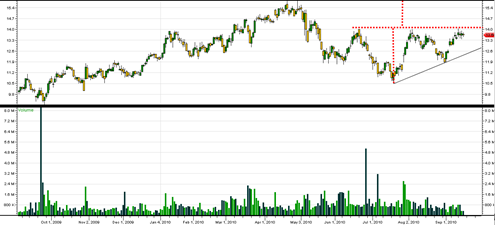
BRKR needs to start printing 1 penny above 14 for some type of breakout activation to occur. There is a decent volume relationship as well that shows the top resistance range should be eventually broken through.
This is not a super fast mover but I would think at least a point can be squeezed out of BRKR from 14 to 15 or about 7%, if it can activate above 14.

The longer term chart of BRKR in the link at the top of this post is really quite amazing as it shows a truly massive potential head and shoulders bottoming formation. The problem with that truly massive potential head and shoulders bottom is that it is not forming after a long market decline. Instead it is formed after a long market advance. I am not quite sure if the interpretation is still as valid. Some caution is necessary in the interpretation of the larger pattern.
BRKR went to 14.04 a few days ago but failed to hold and went back down to 13.5. I have sold out my position for now and wait for pull back. Full stoch is over sold and MACD starting to come down.
I have started to doubt technical analysis!
It seems that the boys with the algorithms are running the show and have factored in how to fake out the tech guys!
So, a few days back I decided to go where the money is. For example I went long on RAX.
Read this:
Rackspace Hosting, Inc (RAX): Internet Software & Services Industry. Market cap of $2,624B. Short float at 24.97%, which implies a short ratio of 12.09 days. Institutional investors currently own 90,736,939 shares vs. 63,884,522 shares held 3 months ago (+42.03% change). The stock has gained 50.97% over the last year.
This seems a perfect play. Number One, RAX is ripe for a merger play. For example from either Dell, HP or even Microsoft.
If you read about RAX it dominates Cloud computing.
But better yet look how the algorithm guys will squeeze the shorts!
And you always have the backup that the funds wont let it fall out of bed.
I guess this is a form of fundamental analysis, but it takes into account how the algorithm boys manipulate the market!
It seems imperative to ride with the algorithms.
Sorry Elliot!
I used to doubt technical analysis before too and was confused whether or not it works. I remember I did not even trust MACD. But then I realized that part of my problem was that I was only looking at one indicator in isolation. It requires a combination of signals to increase probabilities of being right.
I just looked at RAX and I have to say that RAX is one outstanding looking bullish setup right now. Looks like it is getting ready for new 52 week highs. Thank you for mentioning this one. I might do a post about it.
Many stocks and indices are probably manipulated from time to time but I don’t think any one man or group can consistently control any stock or market index, unless we are talking about extremely low float, low priced stocks.