
A comment poster (RiceToaster) asked me whether Bruker Corporation BRKR has any more potential upside to it. I looked at the chart and thought it was worthwhile to do a write up on it.
The long term monthly chart is very interesting because to a large degree it looks very similar to the Nasdaq or PowerShares QQQ Trust, Series 1 chart I have already posted and talked about previously. In that chart I point out that the QQQ’s could be forming an absolutely massive head and shoulders bottoming formation with upside projections much higher than current levels if a successful neckline break engages.
Bruker Corporation looks like a spitting image of the QQQ chart. It is interesting to observe how many stocks have similar structures to the QQQ chart. Some are more perfect than others. But sometimes it is very useful to look at individual stocks behavior to help get a little bit of confidence on where the indices may be going.

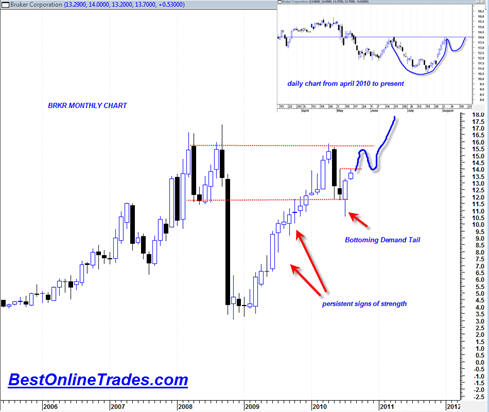
It is very clear from the chart that Bruker Corporation traded persistently with massive signs of strength since March 2009 into the April 2010 high. Since then it has corrected on the monthly chart and it has also recently created a large bottoming tail which suggests that the 12 level will hold as support.
On the daily chart is has recently had a string of upside moves on robust volume up to the 14 level resistance. Today it looks like it is forming a doji candlestick and this could be the pause that refreshes. I suspect that it will now form the handle of cup and handle formation with a pull back to maybe 13. The other scenario is a pull back to 12 range that would create another small head and shoulders bottoming formation.
If BRKR is extremely strong then it will just go ahead and jump the creek above 14 by the end of this week. This seems unlikely given the recent vertical move, but with the employment report coming out this Friday I suppose anything is possible.
There is talk that the broad market itself is in a rising wedge formation. I see the rising wedge but I would also caution that sometimes rising wedges can lead to upside breakouts in extremely strong markets.
The next two days will be very key for BRKR. If it can manage to jump above 14 by the end of this week it would be a very key sign of strength, but more favored risk reward scenario is for a pull back that creates the handle of a cup and handle pattern.
If I was long BRKR at 12 or lower I would definitely bail out right here to see how it reacts at resistance and gets the handle portion of the cup and handle chart. If I was looking for a fresh entry, I would also wait and then if a break above 14 occurs I would wait to see how it retests 14 support and then maybe go long with a stop right under 14.
The sp500 has a similar trading pattern for the last month and a half in that it is right under key resistance level.
My gut trading instinct tells me that the sp500 and a lot of stocks that follow it will jump the creek above resistance this Friday in a rising wedge breakout on the employment report.
I could be wrong, but I think BestOnlineTrades.com is the only trading blog worldwide that tracks the MACD and RSI structure of the monthly unemployment figures. And currently that chart is saying that the unemployment figures are either going to stay flat or start to down tick soon.
Hi,
What are your thoughts on today’s huge gap up in PCLN after earnings. I am new to trading and would like some advice on how to trade this post this huge gap up. Do you expect the gap to fill in the next coup,le of weeks ? Maybe short the thing now ?
Also, What are your thoughtrs in AAPL ? Seems to be underperforming the market recently. Is this is bearish signal or do you think it is just pausing before another leg up ?
Thanks for all your hard work ! I would love to see more intra day posts from you regarding reccomendations on buy / hold / short term trades.
Thanks.
Thanks for the analysis, that’s exactly how I feel right now about this stock. Unfortunately my average is above $14 and I have a feeling that this might drop back to the $12. I’m at a dilemma whether I should sell and take a loss or wait for the breakout. But then again, Friday is a critical day it will either breakout or breakdown.