GLD Looks like a Buy above 151

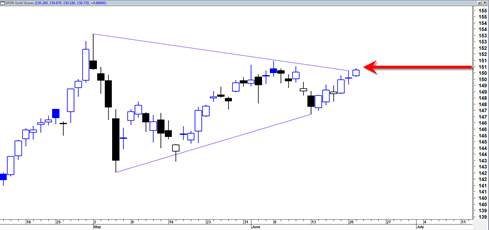
The GLD ETF looks like a buy above 151.  The gold price has been quietly consolidating in sideways fashion the last month or so and all things considered has not undergone significant price destruction. The GLD appears to be in a coiled state right now and ideally would start to lift off tomorrow out of … Read more

Gold Does Exactly what it needed to do today

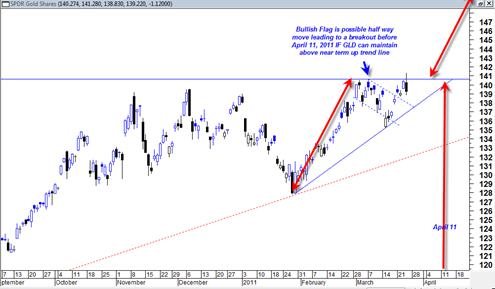
The gold price did exactly what the doctor ordered today.  It consolidated in a small hammer doji type candlestick after yesterday’s monster gains.  This is a bullish sign and bodes well for future days weeks ahead. The GLD ETF could easily pull back to 140.72 tomorrow or Friday and the whole chart structure would still … Read more

GLD ETF Pulls a Rabbit Out of the Hat

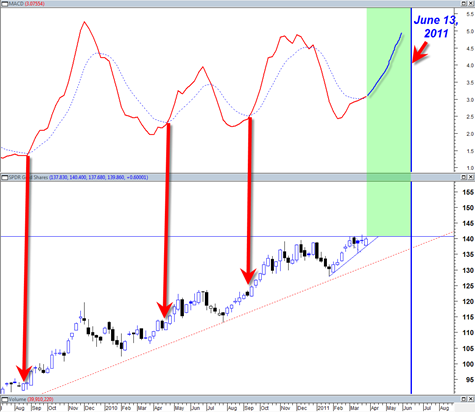
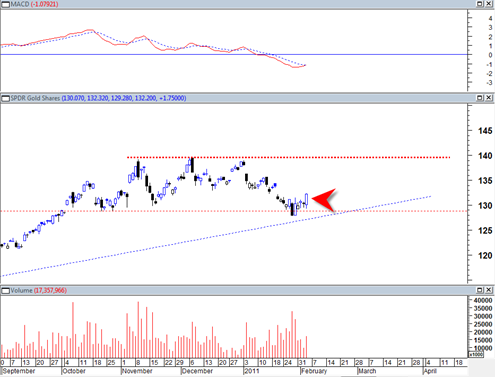
The gold price managed to pull a rabbit out of the hat today and blast higher, which structured the weekly MACD into bullish crossover mode.  As of yesterday there was a risk that the GLD ETF would not be able to achieve a bullish weekly crossover and that instead we would see a ‘bear kiss’ of the weekly trend which would have put the gold price at risk of a possible break down.

Instead this ‘miracle worker’ of a commodity busted higher today and now situates the gold price in a stance for a new life time high type breakout which could be quite dramatic.  I should say though that every time I have expected or anticipated the gold price to somehow shoot up 100 dollars in a day, it has ALWAYS disappointed me and instead trickled up like molasses keeping under the radar of almost every market watcher.

The weekly chart of the GLD is indicating that the breakout should occur during the next two weeks assuming upward momentum holds on the current up trend line.

gld20110331

Read more

Can Gold Break Out to a New Life Time High Next Week

I just reviewed the weekly GLD gold price chart versus the MACD histogram and I think I have to come to the conclusion that there is a pretty good chance that next week is the upside weekly break out week for the GLD to new life time highs.

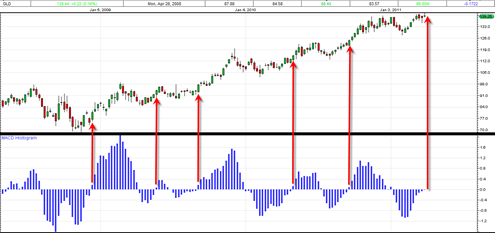
The nice thing about weekly charts is that they tend to smooth out all the noise.  In particular I am focusing on the point at which the weekly MACD histogram transfers from the negative to the positive (from under the zero line to above the zero line).  Every single time since early 2008, this occurrence in the GLD has led to and up week.

Now we see that the weekly MACD histogram is in a similar stance where it looks like it is just inches from transferring from under the zero line to above the zero line.  If the past is any guide, then we should see the GLD finish next week strongly higher in the form of an up weekly closes.  I cannot speak to the magnitude of the move, but it seems one can say with a reasonable degree of confidence that it should be an up move. 

Since the GLD is already so close to trading at new life time highs, I think it can be said that new life time highs should be able to be achieved as well…

Read more

Gold Price ETF does a Teaser Life Time High Today

Today the gold price ETF and the spot gold price rallied up to life time highs but then sold off end of day to settle and close under yesterday’s low.  I have seen this type of action before on the gold price as it attempts to break out to new all time highs.

At this point I do not believe the head fake.  I think ‘they’ are trying to create the illusion that this was a reversal sell off and important rejection of the highs to be followed by another leg down.  I think if they had closed the GLD ETF down much more, perhaps 2% or more it would have made a much more dramatic statement.

Instead, we see that the GLD pushed to new life time highs and tested two important price swings in early March on equal or greater volume, a positive sign.

After hours the GLD bumped up quite a bit, moderating the potential short term bearish looking candlestick.  But again, it is only moderately bearish to me.  I think today is a head fake to sooth the gold top calling crowd.

One mental trick to use when viewing intra day price reversals like we see in the GLD today is to see how negative a close occurs relative to the previous day’s candlestick.   In some cases one can see a strong intra day reversal and yet the close did not even manage to get under the previous day’s high.  In my experience those reversals are usually just consolidations rather than all out bearish trend changes.

Read more

A Potential Bearish Take on the GLD SPDR Gold Trust ETF

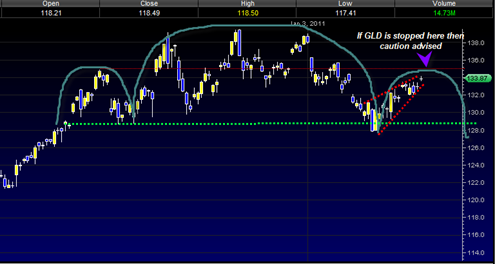
There is always a bullish and bearish take on any stock or index at any particular time.  The recent price action in the GLD ETF appears to have a bullish tone to it.  But when we look at the larger structure there emerges a potentially different scenario. This potential bearish scenario is currently unconfirmed and … Read more