Mining Stock Boom Coming Soon

There has been a lot of ‘chatter’ lately about how the gold price may be at a major top.  I keep looking at the GLD price chart since October of 2010 and have been trying to come to a bearish conclusion but am having a hard time doing so.

It is clear that the GLD has shown a struggling attempt to make new all time highs from the period October 2010 to end of year 2010.  The pattern resembles the somewhat common ‘three drives to a top’ pattern that is occasionally seen in stocks and indices.  But this topping pattern seems to have failed.  During January 2011 we saw the GLD break down, looking like it wanted to confirm the three drives to a top pattern, but then afterwards we saw the GLD take off yet again pushing into life time highs again (into early March 2011) but only for a brief period.

My take is that this most recent push into life time highs again, even though they were only marginal new lifetime highs, should not have occurred if the GLD was in a very bearish pattern.

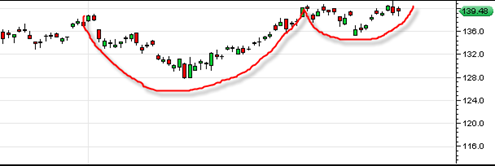
Instead the GLD now appears to have a cup and handle formation with 152 as the projected target (roughly 1520 gold price).

gld20110325

Read more

SPDR Gold Trust GLD ETF Close to a MACD Histogram Confirmed Buy Signal

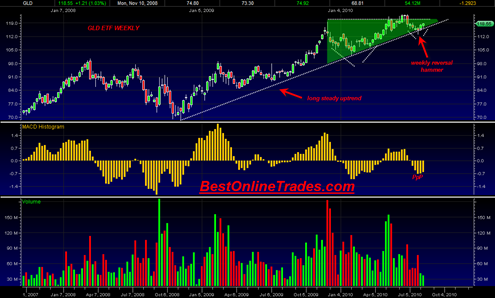
The SPDR Gold Trust (ETF) appears to be close to a weekly confirmed MACD histogram buy signal.  The GLD ETF needs to get a weekly close tomorrow above 118.42.  Currently it is trading at 118.56.

A confirmed weekly buy signal on the MACD histogram tomorrow would in our view be very significant as we are just 2 weeks away from the seasonally very powerful month of September for the gold market.

The weekly chart also shows a weekly reversal hammer of 2 weeks ago in which the trading low of that week tested the neckline of the previous head and shoulders bottoming formation.

The SPDR Gold Trust (ETF) also shows that it was able to crawl back above topside above the longer term up trendline.  This recent move appears to be creating a handle of yet another cup and handle formation which the gold market has been quite famous for time and time again.

gld20100812

One could also argue that the recent 8 to 9 month consolidation resembles that of an ascending triangle formation but is also a cup and handle pattern contained within it.

Read more

Market Vectors Gold Miners ETF Long Term Chart Looks Very Bullish

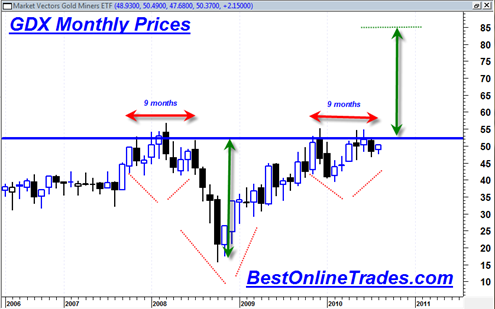
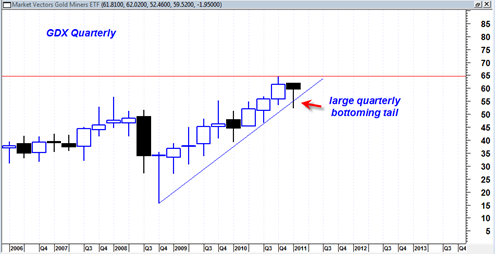
The Market Vectors Gold Miners ETF monthly long term candlestick chart looks very constructive right now.  The GDX has pretty much been left for dead for almost a year now.  The argument has been that because the mining stock index has not broken out to new all time highs, that we should assume it is … Read more

This may be the most amazing gold chart I have ever seen

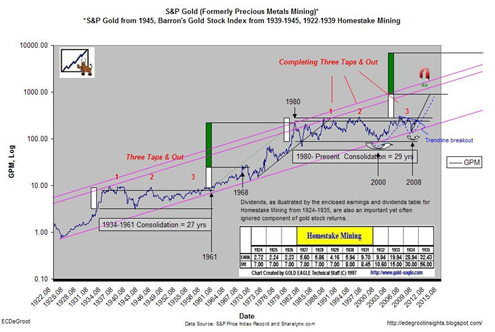
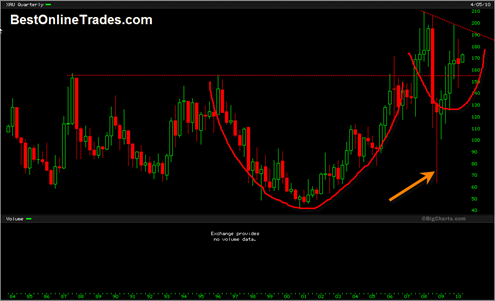
You really need to study this long term gold mining stock index chart.  It was sent to me by a buddy of mine and the chart was made by one of the regular blog posters over at www.jsmineset.com

It is a super long term gold mining stock index chart that goes all the way back to the 1920’s.  What absolutely blows my mind about this chart is that it shows that the GOLD MINING STOCK sector has still not really even had a breakout from the trading range that began in 1980 !!!

This is an amazing chart!

Read more

Timberline Resources Corp TLR starting to look bullish again as a trend trade

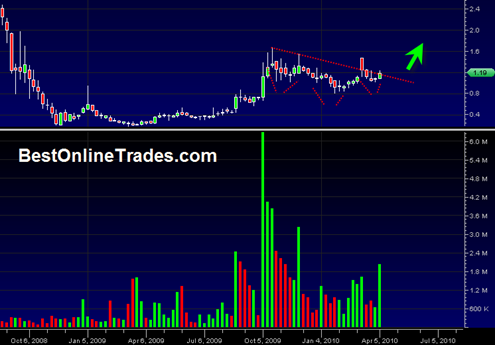
Timberline Resources Corp TLR chart is starting to look quite bullish to me again on both the daily and the weekly price chart.  I had talked about Timberline Resources Corp several other times in the past but it never really seemed to get anything done.

But now it has corrected along with the gold price and if I am correct that the gold price is getting close to shooting higher again, then TLR should eventually benefit from a nice gold price advance.

The problem with TLR is liquidity, somewhat spotty trading and a slow learning curve.  I suspect that even if the gold price does break out north, that Timberline Resources Corp  may take its own sweet time in getting a follow on break out.  That has been my experience with some of these junior gold stocks.

Still the chart structure looks good and it may be a nice position trade for the summer and into the end of 2010.

Read more

A few Observations on the XAU Mining Stock Index

The XAU Gold and Silver Mining stock index has a reputation for being extremely volatile and choppy.  It is a slow moving beast and is also represented by the GDX Market Vectors Gold Miners ETF. Mining stocks and mining stock indices remind me of biotech stocks because they both seem to trade very erratically with … Read more

The Gold Price and GLD ETF Takes a Big Body Blow Today

gld20091204

Gold is getting hit bad today and if you look at the dollar amount on kitco.com it looks a lot worse than if you just focus on the price chart.  The GLD ETF was overdue for some type of consolidation and using the employment report news today seemed like a good enough excuse for the big money crowd to slam it down.

Right now my take is that we are going to enter some type of sideways consolidation perhaps a month long before going higher again.  I say that because I think today’s price destruction in the GLD combined with the huge volume should be enough damage to start a trend change/ and or consolidation.

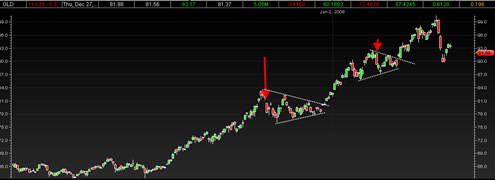
The chart above is the GLD ETF in the 2007 to 2008 time frame.  The red arrows point to heavy selling days that damaged the up trend enough to get the GLD into consolidation mode for a while.  So I am expecting something similar to what occurred in the chart above.

Read more

Gold Mining Penny Stock CVRG Converge Global Setting up for a MoonShot

Before I even begin to talk about CVRG let me say this.  CVRG is a PINKSHEET penny stock that is extremely speculative and has all the normal disadvantages that normally come with pink sheet stocks.  I consider penny stocks in some ways less risky than options because they do not have time decay, premium and expiration, but that does not mean they still cannot cause major heart ache.

I made a decision a while back not to talk too much about pink sheet penny stocks here at BestOnlineTrades because they are an entirely different animal and just do not seem appropriate to mix in with all the other ‘big board’ topics I cover here.  But occasionally I make an exception and I am doing that now.

So having said that, and since I have free editorial reign here at BestOnlineTrades I want to tell you about CVRG, Converge Global.  It is a pinksheet gold mining penny stock.  The ONLY reasons I think CVRG could become a nice play for the next 2 to 3 months are because of the technical setup that exist within CVRG and also the backdrop of a parabolic exploding gold and silver price.

We have already seen a number of gold mining penny stocks blast higher in recent weeks and I expect this trend to continue.  SGCP (Sierra Gold Corp) up 900% from its recent lows, BRYN (Bryn Resources) up 4042% from its recent lows, KATX (Kat Exploration) up 1035% from its recent lows.  So clearly speculation is ripe and the gold mining pinksheet penny stocks are on fire and in heavy demand.  Part of the reason for this is simply a matter of supply and demand.  There are so few gold stocks to choose from that what you will see is ‘gold money’ funnel more easily into the micro cap gold mining plays on pure speculation and lack of other choices.

Read more

TLR Timberline Resources About to Bust Loose and other Market Ramblings

TLR20091125

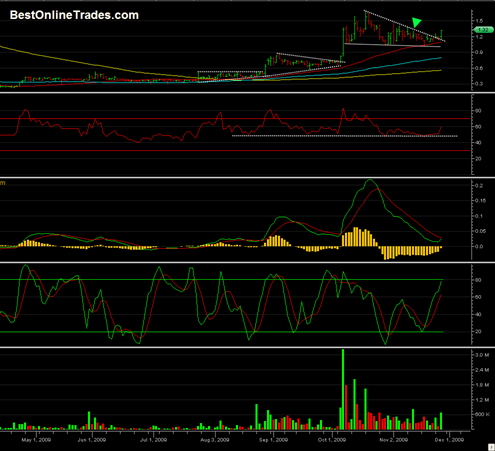
The gold price move seems to be well underway now and today we saw the US Dollar Index have its worst one day drop since July 31st.  The dollar could be entering free fall mode for a week or two that forms some type of capitulation low.  Gold is overbought now based on RSI levels, but at this point I am not seeing any negative divergences.  So it could get a few drops here and there and maybe even form some type of consolidation pattern only to take off again later.

The gold bulls live above the 70 RSI level and they should control the show for at least a couple more months.  The way the gold parabolic blow off and also the broad market are setting up is for a big finale of a run that coincides with the US Dollar Index hitting support near the 70 range.

In the mean time TLR continues to behave quite well and now looks poised for the classic ‘15 minutes of fame’.  Well actually it will be more than just 15 minutes.  Today is probably the first day of a 5 to 10 day rally in TLR.  I am looking for 2.00 as a target to exit.  I think it may have a decent chance to get there within the next 5 to 10 trading days.

Read more