Nasdaq Composite on a Date with Destiny

This may be one of the most important posts and charts I have posted in a long time. Market index analysis has a habit ( at least to me) of being MOST of the time fuzzy around the edges.  But occasionally it starts to crystallize into a clearer picture and better form that helps build confidence on a certain forecast.  It is a matter of making speculative forecasts, trying to identify key levels and then attempting to see whether the tape action starts to confirm your own forecast.  If it does not then one must change tack and work with alterative scenarios.  It is always good to have a small handful of scenarios to work with, both bullish and bearish otherwise it may leave you in a vulnerable position.

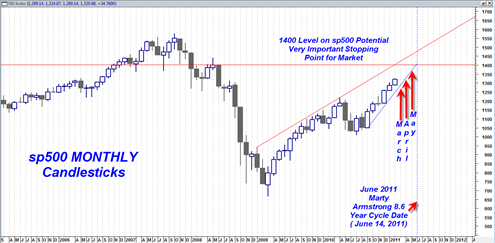
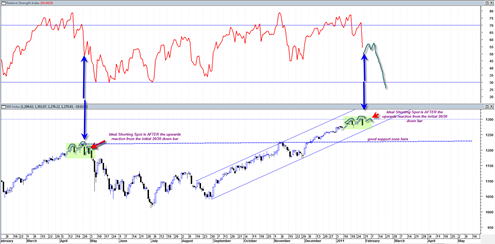
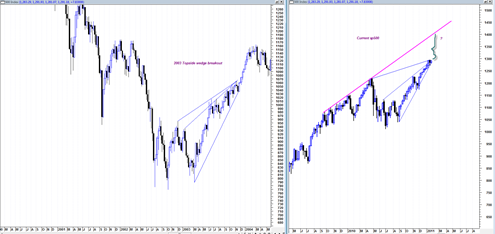
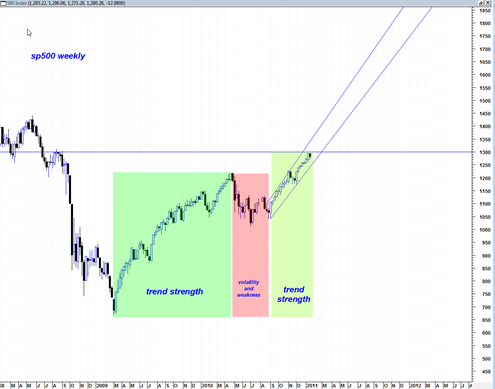
The current market is akin to a 200 car train that has no braking ability.  It is sheer price force and momentum and this is to be respected and acknowledged before anything else.  Having said that, it is also well known that no market can continue to go vertical forever.  There must be a pause so that the market can form a pivot point for a new base that can eventually push the market higher.  Markets build cause and then use it up.  When they are done using it up, they need to build new cause.  Of course after being in a market that seeming only goes up, it is always EASY to forget about any necessary looming correction.

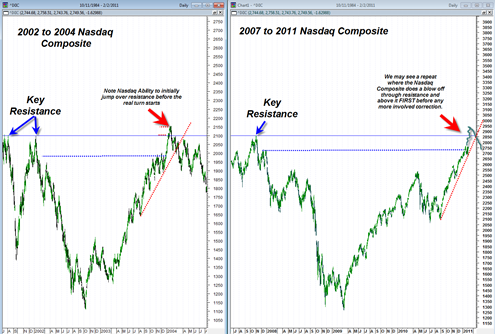
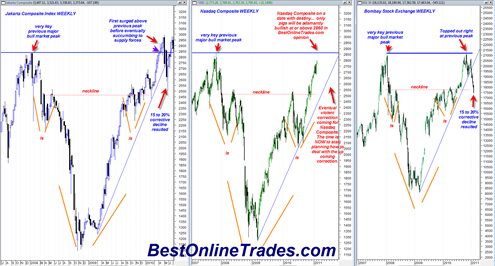
I have been picking on the nasdaq composite a lot lately and for good reason.  The nasdaq composite index is approaching a key level that represents the start of one of the greatest bear markets of all time.  This level was of course the late October 2007 peak in the market that preceded a long duration persistent trend bear market.

The key with the Nasdaq is the issue of how this 2007 peak will be dealt with?

  • Will it simply be exceeded and ignored ?
  • Will it turn on the exact tick of the previous 2007 high at 2861.51 ?
  • Or will it AT FIRST be exceeded and then eventually succumb to supply forces at a later time?

Unfortunately we will not know the exact answer until it actually happens, but we can come up with some scenarios and attempt to get a better feel for the market as we approach this previous all time high level.

Read more

sp500 Monthly Chart Still Shows that 1400 or mid June 2011 is End Game

The more I look at the monthly sp500 chart the more I am thinking this market is going to stall out near 1400 or June 14th, 2011 whichever comes first.  Given the current degree to which the market is overbought it seems like a reasonable forecast. 1400 on the sp500 represents multiple resistance zones which … Read more

sp500 still in Up Trend Mode

The sp500 today continues to be in up trend mode after having broken through 1300.  The sp500 is also still trading within a 5 month trading channel and continues to trade near the middle of the range of the channel instead of at the peak upper boundary or bottom lower boundary. The current trading channel … Read more

Nasdaq Composite Likely Headed for 2850 to 2900 Range Before True Reversal

The Nasdaq Composite appears to be on a mission for 2850 to 2900 range, possibly in blow off or parabolic fashion.  The nasdaq today did a key reversal hammer after a several week consolidation and could imply a big move up that kicks off tomorrow. I am considering the possibility that the nasdaq will ‘run’ … Read more

Back to BOT Long Signal at 1303 and Cramer is Right

The sp500 did not waste any time getting up and through 1303 today so far.  How we close today is still an open question but the strength is undeniable.  This market continues to trade with unstoppable confidence.  It is tempting to short these types of markets but it is not advised. BestOnlineTrades since September 2010 … Read more

sp500 Trading Back at 1300 Again and Back to BOT Long Signal above at 1303

The sp500 is already trading at 1300 again.  BestOnlineTrades.com a few days ago suggested that after the 1/28/2011 decline the market would snap back sharply and then would come the moment of truth. The market has snapped back very sharply exactly as we have suggested and very similar to the manner in which the market … Read more

sp500 Finishes January Monthly Candlestick Today

Today the sp500 finished creating its January Monthly price candlestick.  The January candlestick finished with an up close and without having created any bottoming tail.  A medium to smallish size topping tail was created on the January candlestick by the end of the month.  The market was able to evade the creating of a bearish … Read more