Any Bounce Going Forward in sp500 Near Term Should be Shorted

Today was a clear confirmation to me that we have switched from the massive bullish trend since late August 2010 to a beginning bearish trend.  In yesterday’s post I pointed out the double inside day 3 day price pattern in the sp500 and said it would lead to a huge move either up or down. Today it was clearly down, closed at the lows and also had more than enough volume to go with it.

I think we could get some type of upward bounce tomorrow on some positive consumer confidence numbers but then maybe a sell off near the close.

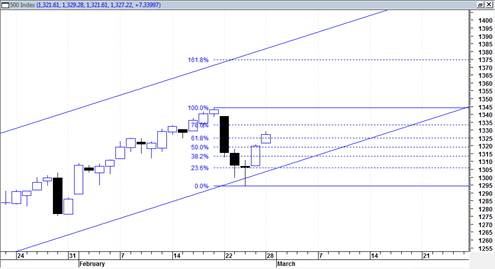
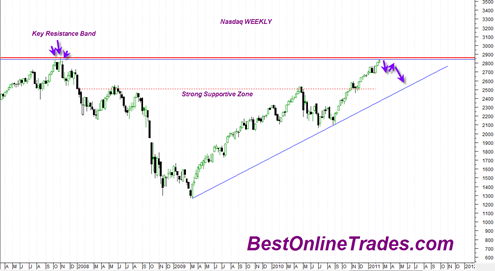
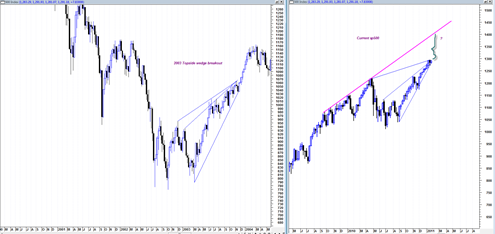
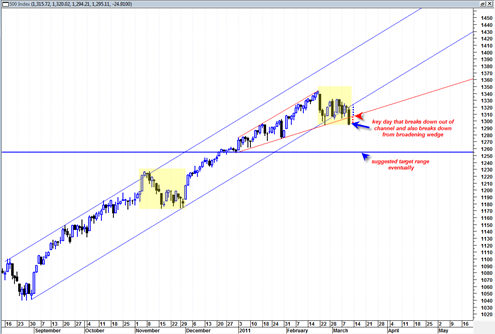
A bounce higher tomorrow could reach two possible levels.  One level corresponds with the underside of the broadening wedge formation I have been talking about now for quite some time.  The other level corresponds to the underside of the up channel we just broke down through.

My preferred choice is that we bounce to the underside of the broadening wedge and then get stuck there for a while and then fail at the end of day.

The much more painful upside bounce level would be back to the underside of the channel we just broke down through.  The reason why it would be more painful is because it would completely erase all of today’s short selling gains.

sp50020110310

So again the preferred scenario is for an upward retracement to the point indicated by the red arrow in the chart of the sp500 above. I would look for any rally to run into a brick wall near those levels and gauge the market carefully from there.

Read more

An Interesting Tug of War Today in the sp500

Today seemed like a bi polar day in the markets.  The market was up down and all around trying to figure out what the jobs report means.  Had we closed at the lows today then we would have fully engulfed yesterday’s candlestick and potentially created a bearish scenario for next week.  We would also have started to create a similar looking situation to the April 2010 topping formation where we saw violent up rallies that were fully retraced down the next day.  That happened several times in end of April 2010 before the market fell apart.

This higher volatility and next day full retracement of a previous day’s surge higher could be a hint of more downside volatility to come.

But still, when I look at the zoomed in price action of the sp500 I see that we are still holding the channel supporting line (bottom solid blue line) and today we tested it again and rejected it by end of day.  We are also still trading within the broadening wedge pattern.

So trading discipline and tape reading suggests that we are still in constructive form and could press higher next week.  We are still creating higher lows after the recent mini correction.

Read more

sp500 Closes Above Key Fibonacci Level

Today the sp500 closed above the key 61.8% retracement level that under normal bearish circumstances would be seen as a stopping point and reversal point for further bear market action. There is still the 78.6% retracement level that is slightly higher from current levels (about 1334), but so far the sp500 seems to be in … Read more

Nasdaq Monthly Price Chart Showing Shooting Star Reversal Candlestick

There are two trading days left in February and currently the nasdaq composite index is showing a very bearish looking monthly shooting star reversal that has formed after testing the old 2007 all time highs.  This is clearly a sign of supply coming into the market and suggests we will have more downside in March … Read more

Stock Market at Possible Ideal Juncture for 10 Percent Correction

The stock market indices including the Nasdaq Composite, sp500 and Dow Jones Industrial Average may all be at ideal junctures for the initiation of an approximate five to ten percent correction. Here at BestOnlineTrades I did a previous forward looking type posting that speculated on the initiation of a correction in the Nasdaq Composite.  I … Read more

Nasdaq Composite Likely Headed for 2850 to 2900 Range Before True Reversal

The Nasdaq Composite appears to be on a mission for 2850 to 2900 range, possibly in blow off or parabolic fashion.  The nasdaq today did a key reversal hammer after a several week consolidation and could imply a big move up that kicks off tomorrow. I am considering the possibility that the nasdaq will ‘run’ … Read more