You have probably heard the expression ‘Buy the rumor and sell the news’ ? Well that strategy works very well when you are looking to go long a particular stock on some forward looking news.
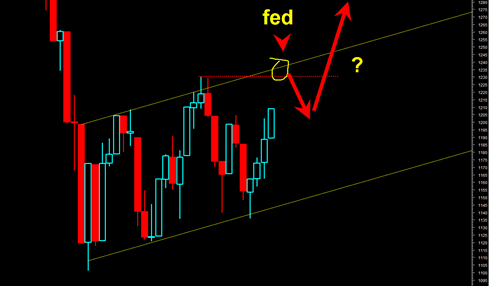
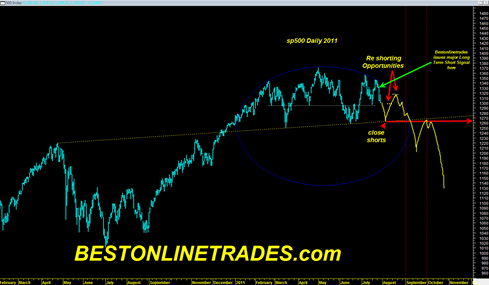
The opposite of buy the rumor sell is the news, is ‘Sell the rumor and buy the news’. This is exactly what I think is going on right now. Traders have already begun selling the upcoming news next week (shorting it) and when the news arrives (whether it is debt news, or Fed QE3 news, or maybe something else) they will very likely buy to cover and close shorts right on neckline support.
Meanwhile major news networks are providing us with great informative updates about how the market will crash and it will be Armageddon next week. I think even MSNBC showed a price chart of the DJIA a day ago showing how it declined. All of them are talking about the stock market and how it will fall apart. To give them some credit, they have been right about the decline leading up to the news.
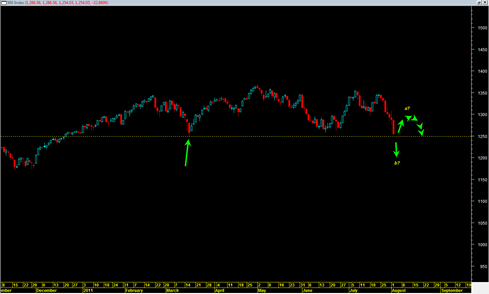
So I currently recommend closing all shorts near the 1265 to 1270 sp500 range or the DJIA 12000 range. I believe this support will hold and the market will bounce from there. Of course that is not guaranteed. Will have to see how the market reactions on neckline support and then take cues from there. But I suspect we will see a mini capitulation near these levels. We may dip under these levels briefly but I suspect it would only be for a very short time frame.