BOT Short Signal at 1310

I am putting the BOT short signal back on again on the sp500 at 1310.  The bounce is not arriving and I would rather put the signal on now.  Whether we bounce 10 or 20 sp points from here seems to be a mute point for now. Yesterday was a HUGE sign of weakness and … Read more

Marty Armstrong Cycle Model Nailed the Top in Real Estate in 2007

The 8.6 year global cycle model of Marty Armstrong nailed almost perfectly the exact top in the IYR real estate index in February 2007.  The exact date was February 25th, 2007.   I find it quite fascinating that his 8.6 year cycle model nailed the exact turn in the real estate market and yet it appears … Read more

Unemployment Rate to Start Falling into end of 2010 and early 2011

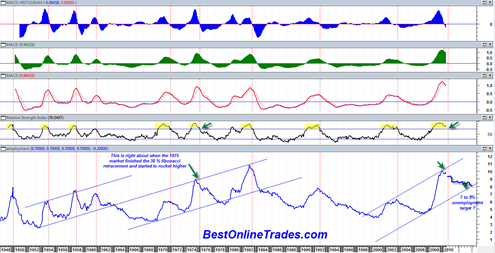
Over the weekend I created what I consider to be an absolutely fascinating chart of the unemployment rate going all the way back to February 1st, 1948.  I plotted the unemployment rate based on the monthly figures I have going back to 1948.  So the chart you will see below is essentially a monthly price chart except that the data is the monthly unemployment rate instead of stock prices.

I have never before seen the monthly unemployment rate plotted along side typical momentum indicators and oscillators.  Everyone holds their breath before the monthly unemployment report comes out and counts on it as a major market moving event.  But if it was so important then why is it not always viewed in chart form to help better identify unemployment trend, momentum (or lack thereof), and historical context ?

The unemployment rate can be tracked in terms of MACD, Relative Strength and many other indictors just like stock prices can.  There are buy signals and sell signals in the unemployment rate and the validity of them is probably more significant than most other charts because we are dealing with monthly data points indicative of longer term trends which are less likely to whipsaw.

Read more

The Most Powerful Cycle Model Ever Created

In case you do not know about it yet, I would like to tell you about what I believe to be the most powerful cycle model ever created.  I did not create it.  It was created by a man named Marty Armstrong who headed the former Princeton Economics Institute which was an institutional advisory and money management firm.  PEI as it was known has since been shut down by the United States government for reasons I can’t speak to because I don’t know the details or facts about them.  But I will say that it is a crying shame that their business and knowledge was shut down because it was in my opinion some of the most valuable and important financial knowledge ever devised.

The former website itself used to have unbelievable amounts of historical research on money and financial panics going back hundreds and even thousands of years.  The only reason I know about it is through a radio program that used to play in California and was hosted by Buzz Schwartz, a trader and radio host.  He used to have Marty on as a guest and I listened to their interviews and his advice on markets.  I also got a few of Marty’s monthly ‘Capital Market Review’ publications and that is how I am able to tell you about his cycle model.

Read more