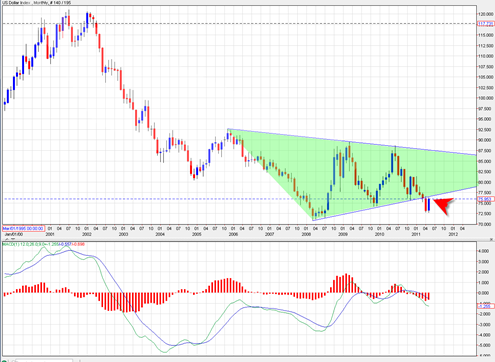
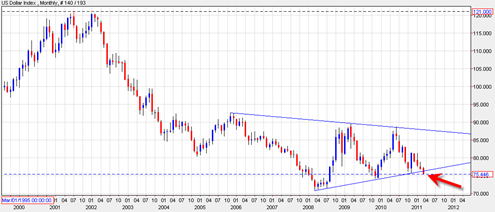
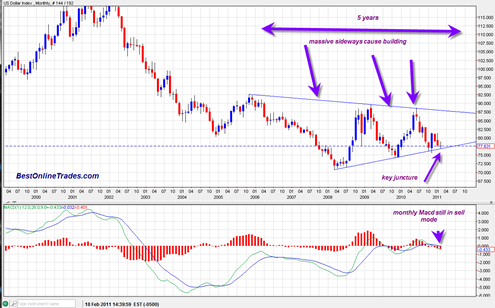
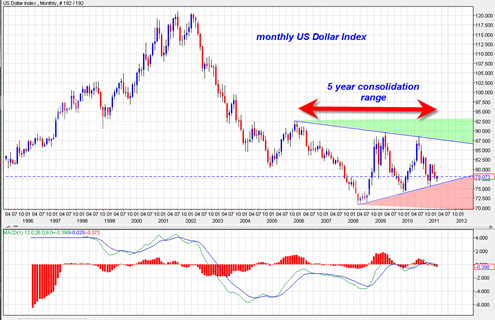
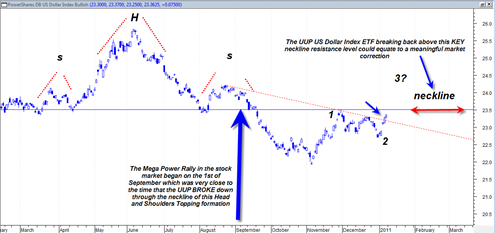
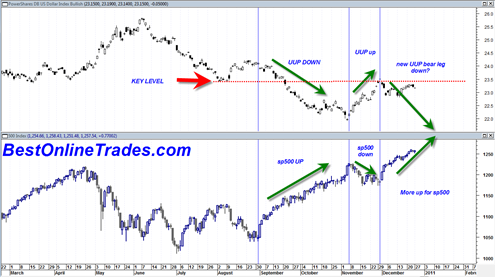
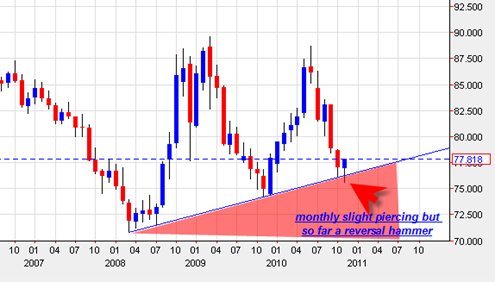
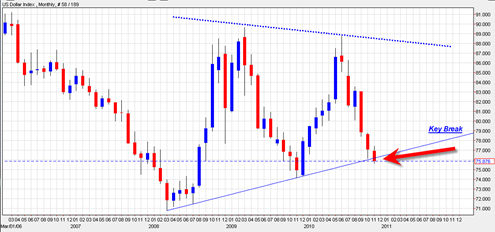
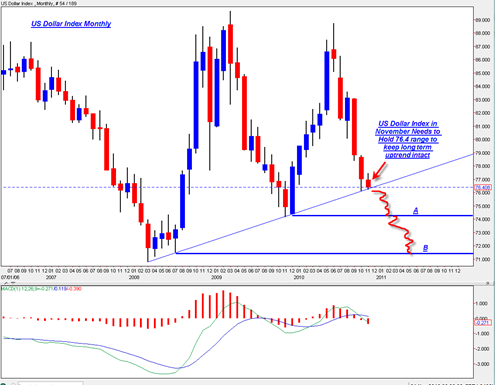
The US Dollar Index is at an important juncture. On the long term monthly candlestick chart the US Dollar Index has shown us that it has broken down through and out of a very large symmetrical triangle formation. This was very bearish action and seems to imply much more longer term bearish action for the US Dollar index.
The problem is that sometimes symmetrical triangles on all time frames turn into failures and busted patterns. A busted pattern symmetrical triangle exists when you first get a downside breakthrough out of a symmetrical triangle and then the price loses downside momentum, reverses, and then busts back up inside the structure of the symmetrical triangle and then busts back up topside in an upside breakout of the pattern. Busted patterns can be very powerful signals on all time frames.
The location of the US Dollar Index right now on the monthly chart is not suggesting to me that we are about to be in a busted pattern, but the chart is showing that there could be some potential for a busted pattern to occur.

