
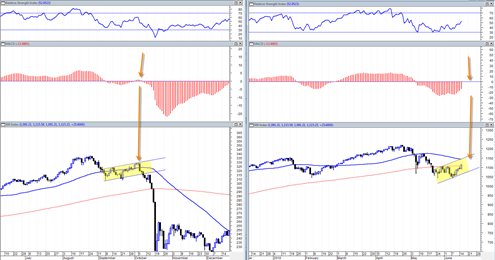
The RSI today on the sp500 hit a value of 53 based on the closing price. After the 1987 final upwards reaction rally was finished and just before the 10 day super plunge, the RSI was able to get to a value of 60. On June 2, 1930 the market hit an RSI value of 54.3 and that was the final exhaustion before another 20 to 25% drop.
So what I see right now is the 50 day moving average barreling towards the 200 day moving average in what will likely create a ‘death cross’ signaling a confirmed bear market by next week some time.
I view the current rally that began on June 8, 2010 as the final ‘set piece’ that will allow the market to get overbought enough (between 53 to 60 RSI Value) so that it can plunge into end of June and early July.
IF we are in a true bear market right now then the rally that began on June 8, 2010 should be sharp but relatively short in time duration. If this is a true bear, then this rally will only serve one purpose, as FUEL for an even more severe and persistent down move possibly starting as early as next week. That is the nature of bear markets, quick and sharp rallies that fail relatively quickly and then use the new overbought level as fuel or energy for an even stronger decline leg.
I don’t see the decline beginning any time this week. It looks very unlikely now since we have triple witching options expiration this Friday. But the week after that has the potential to be devastating in my opinion.
But again, I am looking for an RSI target of between 53 to 60 before the severe decline resumes. If for some reason we blast higher than 60 RSI (by the end of next week at the latest) then it is game over for the bear case. If that happens then this market may create a new all time high and just continue to create a super squeeze.
I am roughly looking for maybe 5 more trading days of either sideways or UP price action before we can start to feel confident about looking for a renewed turn signal.
When and if renewed turn signal finally does come, then I would expect to see nothing less than fast severe and PERSISTENT price decline that has very little support and strong downward momentum.
I get a little bit sick in the stomach when I think about it, but it does look like 1150 has a good chance of being hit, maybe even slightly above that. It all depends on how much the forward momentum is able to sustain itself.
The astro dates I mentioned in my previous post (June 17 to 25, 2010) would seem to have their greatest effect next week if they are valid. Actually they still fit into the picture quite well. But for them to work, then we really need to see the market show major signs weakness next week.
Regardless of the astro, after this rally loses some momentum, the key will be to see the market show a major sign of price weakness in the form of a negative 20/20 candlestick bar. It needs to show a candle that would be out of the normal expectation of this current rally that began on June 8, 2010.

I just reviewed my weekly charts and they seem to confirm that NEXT WEEK would be ideal for the decline to resume in earnest. If we are not breaking down badly by the middle of next week, then clearly something is wrong with this analysis.