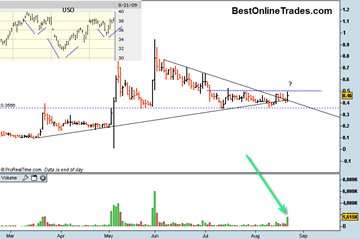
EPEX is trying to get some kind of a breakout move going but so far has been unable to get any kind of confirmation.
On Friday August 21st, it did manage to get another upward advance within the rectangle (defined by the blue horizontal and blue dotted horizontal) and also get a close above the down trend resistance line. The volume also got a nice surge going today and may be an early sign that EPEX is close to getting above the .50 level.
It needs to get above and hold above .50 for me to start thinking a new uptrend has started. So far still a no go, but I will take today’s action as a possible early clue.
Also note on the EPEX oil stock chart (click on it for full size) above the top left corner of the chart where I show the USO oil ETF. It is possible that the USO oil ETF is close to completing a head and shoulders bottom formation. I would think a northward breakout from that formation would definitely help the cause of EPEX finding a way to get a new uptrend going.
The reason why I keep coming back to this chart is because of that volume swing high test of early June versus the early may swing high. Had that not occurred then I probably would not keep coming back to this chart.
The volume is like candy. It just keeps me coming back for more…

