
The sp500 blasted higher today and the QQQ is within inches of a new 52 week high. It is starting to look like the markets are going to break out to new all time highs if they can manage to evolve into breakouts from the head and shoulders bottoming formations I mentioned in a previous post.
Curious however is that on the SPY there still seems to be a valid structure of a head and shoulder top. It is only the most recent price action that seems to have formed a H & S bottom. The H&S potential top pattern is the much larger of the two and seems to carry more weight in the decision process.
Is it possible that today’s rally was simply a low volume ghost rally?

I probably should have just switched to neutral a long time ago as the last several months have been nothing but swing trading range and choppy. The market has been range bound for a long time and is still currently right in the middle of ‘no mans land’.
One has to give the market credit for being able to stay range bound as we have over the last 5 or 6 months.
On the other hand the long term monthly chart of the sp500 still shows some potential for a big drop into the September 2011 time frame. When I look at the XLF and the SMH both look like they are setting up for a huge drop into September 2011. Are they to be completely ignored ?
Today’s ‘huge’ rally on the SPY was not accompanied by the volume to make it legitimate. But the price bar did still close near the high.
So the bottom line is that I do not have any major conviction in either direction. Added to that is the fact that end July and August seasonally speaking are not exactly the best trading environment. This should lead one to be extra suspicious of the conviction of any big market moves until September. A day like today with DJIA up 200 points makes every one take a big sigh of relief, but
September is when the big moves with conviction usually happen.

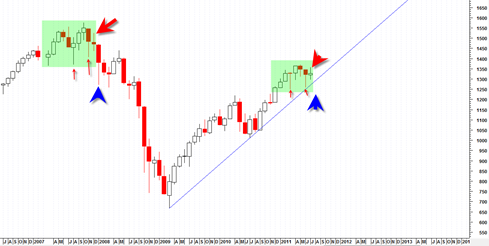
The chart above shows the monthly sp500 chart and the two small red arrows show the similar bottoming tails or hanging man type monthly candlesticks that were present in the 2007 time frame and the current time frame.
The most recent monthly candlestick shown with the big red arrow is also similar in formation and looks like a monthly DOJI candlestick. It should be noted that the current July Monthly Candlestick is not officially completed, but will be in about 10 days.
If the current July 2011 monthly candlestick keeps its DOJI formation then I am at least open to the possibility to that the month of August 2011 could be a massive red down candlestick similar to the one that is shown in 2007 (the big blue arrow).
If that occurs then it would also accomplish a massive trendline break of the bull trend line in force since March of 2009.
The bear market that started at the large blue arrow on the left portion of the above chart was also a similar trend line break of the entire bull run that began since 2003.
But again, the market is still in ‘no mans land’ right now. We need to see a failure of today’s rally and a renewed break under 1313 for me to really get much more bearish conviction.
Possible catalyst for September crash
http://www.economicpolicyjournal.com/2011/07/israel-iran-war-in-september.html
I had been contemplating about going long for a couple day swing trade but wasn’t sure about pulling the trigger. But after Tom made the bot short signal, I pulled the trigger and went long SSO (twice long SP 500) and am in the profit nicely today lol.
But on a more serious note, I mentioned the HS over two weeks ago on one of my comments and its still in play. But shorter term, looks we have a bull flag playing out, and yesterdays pivot was a beautiful .382 fib retrace from 6/23 low to 7/7 high. Today’s move higher seems like the start of the bull flag playing out and the fact that it bounced off the .382 retrace makes me think that there is a bit more juice left in the bounce. Yes volume was light and that makes me very cautious. But with the overall bearsih sentiment out there, a bounce wouldn’t surprise me. If the debt deal gets passed along with good earnings, markets might test the 52 week highs. Also, if a big pattern fails, ie the HS mentioned above, often times a STRONGER move occurs in the opposite direction. So if HS really does fail, could we possibly be see another leg higher as many Elliot wave chartists are predicting?
I don’t think that will happen but still a food for thought.
BUt right now there are too many contrasting signals to make any long/short call. Probably best to go neutral for now until the market proves with conviction which way it wants to go. My guess is lower.
Ed, that’s an interesting link. But frankly I think its just more hot air. Israel couldn’t possibly be stupid enough to attack Iran unilaterally. And There is no way that US would back Israel to attack Iran; that would be political suicide. Any significant war in the middle east would cause oil to go through the roof and would probably cause the world economy to go into another recession.
Sideways is the way to go till September. Then we will see the next leg up. Still stand by that theory.
Dont think all that force will do anything to support that fight in Sept. they are there now for Libya.
i presume that “bestonlinetrade” is still operating on a BOT Short signal at 1302. ? .