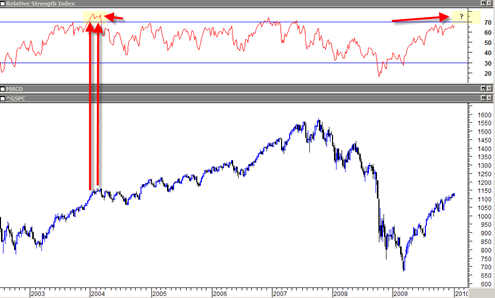
It is worthwhile looking at the longer term weekly SP500 chart plotted alongside weekly RSI as a reminder that no matter how high current bullish sentiment is, the market can still go higher.
The simple chart above shows this clearly. During the 2003 recovery there was a long persistent rally that kept pushing weekly Relative Strength Index higher and higher until it formed a shelf and then blasted higher again above the key 70 level. RSI held above the 70 level for a few months until the market finally got exhausted and started a multi month labored correction.
Current weekly RSI readings on the SP500 are showing that we are still in the mid 60’s range and have not as of yet broken north of the key 70 level. I would not be surprised to see us do just that sometime in 2010 perhaps going into March-April 2010.

