
Today was an inside day in the sp500. The price range was small and the market was not hinting at any big moves in either direction. The last four days appears to be a simple pause in the uptrend.
Tomorrow if we are able to hold 1140 or higher then I have to presume that the uptrend since end of August is still intact and there is possible room for more upside trend strength. Anything below 1140 does start to put in some caution flags however.
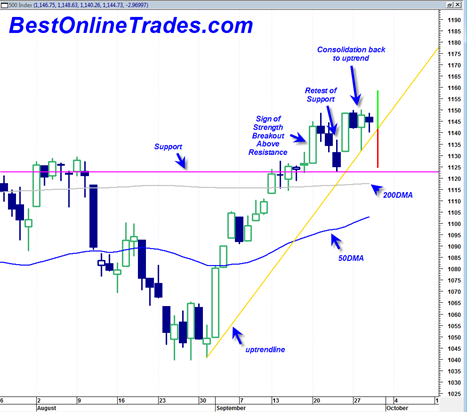
The 50 day moving average is trending up and with upward slope now. It is not too far away from the 200 day moving average which currently has a very very slight upward slope. A golden cross to the upside may occur sometime in October if price can manage to stay above the 200 DMA for another few weeks.

The chart above shows that the pink colored horizontal line is key support which was already tested. If we do break below the yellow trend line then it will be very important for the pink support line to hold.
There is another line that can be drawn parallel to the yellow line creating a price channel which possibly indicates a move to as high as 1175 in the sp500. Tomorrow is the last trading day of September and the last day of the quarter. It would seem possible that the market has one more day of upside juice in it given the recent consolidation above trend line support.
The last day of September appears to be a key day in the market as it will either reconfirm this uptrend or start to put it in doubt. So again, I have to presume that the upside will win tomorrow since that has been the previous bias and also because support was recently successfully tested.
The banking indices continue to lag quite badly and is maybe still that fly in the ointment that could cause some type of reversal soon and maybe pull the broad market indices down.
If I had to come up with a bearish scenario, it would be price action either tomorrow or October 1st that prints similar to that red colored vertical line in the chart above. That would indicate a broken uptrend. Then, to add very significantly to the bearishness would be a loss of price support and break under the pink horizontal line. That would in essence create a 2B sell signal which has the potential to be quite bearish.
Relative Strength Index and daily MACD does look quite toppy right now as well. Volume has remained lackluster which is a valid concern but I am still not sure if it is enough to win me over to the bear case yet. If I have time later today I will try to do a volume analysis again using average volume between price swings which is a new market method I have been learning from Tim Ord.
I think the determination of which scenario plays out rests on tomorrow price action. Tomorrow either re asserts the recent strong bullish trend or it catches the bulls off guard and makes them question the power of their convictions . . .
Like you I am getting all sorts of conflicting signals. For example it looks like the McClellan Oscillator is turning over. This could mean that it is about to cross over into bearish territory. But this is all typical of indecision patterns.
I think the next few days are critical for the bulls. I am flat and will remain so until I have a firm grasp on the direction.
Shame on me. I forgot to mention the Mcllelan Oscillator. Yes it does look like it is slowing momentum but not really at a confirmed turn yet…
i say the top and bull market fake-out is 1168
before the plunge, U need a healthly bull-trap, to destroy the retailers
THE REAL REASON WHY SHORTS ARE GETTING KILLED AND WHY OUR INDICATORS DON’T WORK LIKE THEY USE TO
http://www.zerohedge.com/article/only-reason-stocks-have-rallied-month
I think we topped today, but am awaiting more confirmation. But for all intensive purposes I am calling for down to start Oct 1st onward.
Well the indicators of volume seem to be working. I don’t think they can lie about that… and it has been too light on this rally on an average basis…