
What is the verdict? The sp500 has for the last couple of weeks been trading in a rectangle formation with bit moves to the upside and big moves to the downside. Add up one big up move minus one big down move and the net result is zero progress. Or is it?
Well it is progress towards an eventual outcome that will either be bearish or bullish.
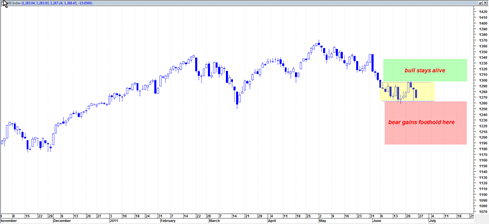
The Bullish Case
The bullish interpretation is that the current trading rectangle formation is a pausing point of the recent mini bear and then a reversal point where prices consolidate and then bust out north from the rectangle.
The bullish interpretation is currently supported by the fact that the recent mini foundation of price work is on a lower relative volume than occurred on the SPY in mid March 2011. That would seem to support the case that the current rectangle is serving as a pause point and reversal point.
The TOP of the rectangle is defined by roughly 1296 and price closing action above this rectangle could start to validate the bullish case.
The BOTTOM portion of the rectangle is 1262. This level still represents a ‘higher low’ with respect to the Mid March 2011 low. So that is another potential shorter term plus point for the bulls, for now. No bear market exists if the market is printing higher lows.
The bulls also have a daily MACD that is currently in a bullish crossover.

The Bearish Case
The bearish case says the current yellow shaded rectangle is simply a consolidation point that pauses before a renewed continuation down again under 1262 and then sharply toward attacking 1250 for the creation of a lower low relative to mid March 2011.
The bears have the monthly MACD histogram on their side that is currently printing a very large bearish divergence.
The bears also currently have a weekly MACD in negative crossover mode.. although admittedly this has been the case since March 7, 2011 which does put risk of the market being in an oversold situation.
Current Conclusion
The yellow trading range is where the battle will be won or lost. The current ‘higher low’ situation relative to the mid March 2011 swing low is giving the bulls the current edge. However, the monthly tape trend still shows a bigger picture potential mega bear.
The answer to whether we are in a mega bear or baby bear will depend in part on the change over from the June 2011 to July 2011 monthly candlestick price bars which will be depicted in a forthcoming chart.
Tom: Is the market cracking or still running? If this question isn’t resolved in the trader’s mind– stay away, for the DURATION. The duration can be a week, a month or years. In other words, when in doubt, don’t. Easier said than done! As Jesse Livermore learned (and managed to repeatedly ignore) during his roller coaster & literally suicidal career, he made most of his money by managing to sit tight and do nothing. Non-trending markets will make you crazy and clean out your trading capital if you aren’t careful. But as we can see from reading Livermore’s story, sitting went against the trader side of his personality, which always craved action. Traders should have hobbies to burn off this itching desire for action.
Tom: Is the market cracking or still running? If this question isn’t resolved in the trader’s mind– stay away, for the DURATION. The duration can be a week, a month or years. In other words, when in doubt, don’t. Easier said than done! As Jesse Livermore learned (and managed to repeatedly ignore) during his roller coaster & literally suicidal career, he made most of his money by managing to sit tight and do nothing. Non-trending markets will make you crazy and clean out your trading capital if you aren’t careful. But as we can see from reading Livermore’s story, sitting went against the trader side of his personality, which always craved action. Traders should have hobbies to burn off this itching desire for action.
Hey tom,
From my post back in March\April it looks as though we have gone sideways pretty much. I still stand by that call with a move to the upside come Sept. The month is wrapping up and will see an upward move to close the monthly candle near the top of the downturn. I am sure we will see another down move come next month but will subside once again. We are about to have a cross on the monthly chart so going purely by technicals, and not by any garbage they put in the news, we will see an upside in the second half of hte year.
Good points Neal.. as of today I think it will run much higher again…
The volatility of last two weeks cleaned out a lot… and as you correctly mention was not worth trading or trying to give signals inside of..
Great call Larry, you have been spot on… and today seems to confirm it with a weekly MACD histogram confirmed buy signal…