
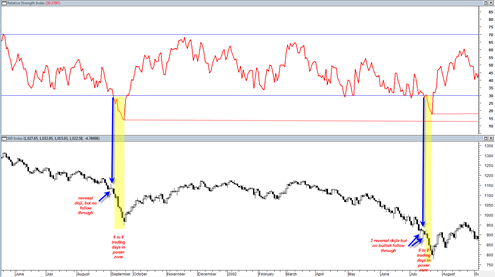
The candlestick reversal hammer that printed yesterday 7/1/2010 was not confirmed today. The bulls needed to get a close above the 7/1/2010 candlestick to say we had a real market reversal or short term bottom. They did not get the job done today and even worse sold the market off a bit right during the last 5 minutes into the close. On some indices the last two days look similar to the two printed dojis we saw on 6/25 and 6/28. After 6/28 we had a 3% down day. So again these dojis seem to be indicating a pause in the trend but not a reversal of trend.
Looking at the NYSE McClellan Oscillator and summation index I see nothing but more indications of continued downward momentum. The NYSE summation index reversed at the zero line and since then has had strong momentum to the downside that seems to be gaining steam.
You remember the bullish move from 2/5/2010 to 4/23/2010 ? It seemed like the market was an unstoppable train. It seemed like 1999 again but maybe not as glamorous. It felt like the market was invincible again. Doji and hammer reversals were completely ignored and the market just kept going and going and going, the market was climbing a wall of fear, although there was probably not much fear left at that time.
Now it seems like there is fear everywhere and the bulls are hoping for a bounce to change the trend. Those who missed the shorting opportunity on 6/25/2010 are still waiting for a nice big bounce to get an ideal short. So my question is, what if the bulls don’t get their bounce reversal and the shorts don’t get their ideal shorting opportunity next week? The answer probably is that the market just tanks where bulls finally capitulate and new shorts pile on late in a frenzy before they miss the boat.
Today’s closing RSI is 30.27 on the sp500 and once again we are sitting right on the edge of the cliff with no bounce so far and no conviction about going into the sellers ‘power zone’ below 30.
My take is that somehow the market will find a way to get into the sell powerzone next week. A lot of energy can be built up over a 3 day weekend going fresh into next week. The question that remains is whether or not we still get a 4th of July inspired bounce to either 1040 or 1070 on Tuesday 7/6/2010 of next week. I really don’t have an answer to that question. I was looking for a big one day bounce up today but it did not happen and there was no follow through. At this point I will just have to flip a coin on the one day bounce scenario. Perhaps it is a mute point since the weekly trend is still clearly strongly down.
As far as the 1987 pattern similarity and the ultra bearish ultra fast decline scenario, my take is that it really only has about 5 trading days left to play out. As I pointed out earlier, what we have not seen yet during the last couple of weeks is ending action or capitulation (wide price spread climax type move). I think we need to see that type of action to blow out the current downtrend and finally get next consolidation phase. So far we have not seen it, but I still think it is coming and I think it has a decent shot at occurring during the next 4 to 5 trading days given the fact that the 14 day RSI is perched right above the bearish powerzone line (30 RSI value). Four to five trading days is plenty of time for the market to move big and get the RSI in between the 10 to 30 range.

In the chart above you can see that this weeks candlestick clearly closed below the important supportive range we have had going all the way back to September of 2009. So far we have had a –3.6% down week followed by a –5% down week which closed this week out. So my sense is that this slow gradual progression of weakness will turn exponential next week and maybe the week thereafter as well and that ought to be the selling climax.
Today we closed at 1022.58 and so a 10% decline from today would put the sp500 at about 920. 950 was the area I pointed out before as being strong support. But what I have noticed many times is that when you can fast market moves to support area a lot of times what happens is price at first goes deep into the support and slightly under it before realizing it is valid support and often ends up closing right at the support level.

So it would seem that the next couple of weeks will finally get a price climax going. I did say that we would see a big volatile move going around the days of this 3 day holiday weekend but it was not meant to be. So maybe it is better to focus on the weekly chart structure for better timing.
Maybe somehow BP will plug the oil leak up by the end of this weekend and it will be good for 300 DJIA points on the upside… just a guess.. but again, any rallies really should only be one or at most 2 day affairs to keep the strong downward momentum intact.

The chart above shows two other times where 14 day daily RSI broke below the 30 level. I suppose this is the alternative to the 87 scenario were we decline in a more orderly yet persistent fashion.
You can see that in both periods above once RSI was decisively below the 30 level price continued to decline for another 5 to 8 trading days. It should be noted though that it took RSI a long period of bounce on and above the 30 level before a true downside break was ever achieved.
The other reason why I would really like to see a capitulation soon (within the next 5 to 10 trading days) is because earnings season will start to kick in after July 12. It would be better for us to get down much lower soon and then have earnings season kick in rather than the other way around.
Hi Tom,
Thanks for the update. As I said sometime before, market will show megaphone pattern and DOW stopped exactly at megaphone pattern bottom. Some days before when DOW as at 9800 and S&P at 1130, I was wondering whether Megaphone pattern will hold as any close below 1114 for S&P invalidates. But DOW fell and S&P did not fall by that margin.
I think there will last downleg of 10-15 points on S&P to shake out bulls but I am sure S&P will rise to 1150 and then fall hard.
If S&P touches 994, I will have stopped out.
Hoep for the best,
Shirhas
Unless there is some incredible positive event, i find it unimaginable that S & P will soar to 1150. I agree that we are at low end of Slow Stoc and market could turn, but it could also power a lot lower to the surprise and chagrin of all, including many of the bears.
I would be totally surprised if Corporate America in the upcoming earnings season was to give upbeat forecasts for the future. For one thing, the comparisons with the rest of 2010 to 2009 get more and more difficult. Managements will want to be very circumspect in order not raise hopes. There is still way too much uncertainty coming out of Washington, and the elections are coming up in only 4 months. The markets will anticipate this uncertainty.
My guess is that we will get a nice bounce but from a lower level – – a lot lower level (perhaps about 900 to 950). If the break comes sooner than the market could rise – – perhaps going into elections – – – a plus for the party in power
Well to be honest with you I would much rather see this market crash and do so very fast within the next 5 trading days. If it does not then it will start bouncing all around earnings season. Earnings are still likely to be good and I would much rather see the market down a lot more before we get into the season. I think we are going to see a 2.7% rally Tuesday as a one day rally and then fall down for 4 straight days…
Tom
how on earth do you come up with 2.7%? no reply necessary, a rhetorical question.
my “money” is on straight down relatively hard, but i would not call it a crash – – but i think down to 9200 to 8700 which is only another 5% to 10% down at most. i should probably keep my mouth shut and not jinx anything, but the TZA chart sure looks interesting.
sure earnings will be good. no doubt. but that is last quarters – – the focus will be on what managements’ say going forward. i would be flabbergasted if they indicate a lot of optimism on the future. even Apple, with the best product on the globe, was blindsided by their supposed software glitch. Also, the Tech sector / handheld devices is getting extremely competitive (1) HP buying Palm is not spending $1 Billion to roll over (2) Google has entered the race, (3) Rimm is not going to go down without a fight, and (4) neither is Nokia, and finally (5) Cisco wants to create an IPad device for business crowd! To me, the hottest sector of the market looks to be incredibly dicey and crowded area in the next 6 to 12 months. Crowded with huge players with very very deep pockets. And if this is the hottest area of the market, and it looks dicey – – what does that say about the overall market.
I looked at the AAPL chart yesterday and it looks like a total collapse is coming during the next two weeks… It should help some of the tech indices go lower. The 2.7% is a complete guess. 1040 to 1050 is a better guide.
Hey, let me get my two cents in. I agree that S&P will find 950. We all know a common retracement is 50%. But the real question is where we go from there! This country is operating like it has a money tree, and with this recession on peoples personal “assets” we will pay the price to be a debt nation. I don’t mean to get off the topic but look at it this way. If the government was ran like a business how long would it be open? We “the economy, stock market, and society” fall faster than we rise. Could we be in a sidewise market for an extended period of time because our country is outsourcing “our jobs” and printing money like fools?
All things are connected and we are only as strong as our weakest link.
I will wait for the parade to start moving again. But it’s got a long way to go before crossing the 200 day avg and continuing the bull run. Guess I can take this time to pile up cash.
Nice comments Austin.. I think that is worth more than 2 cents 🙂 I think one of the biggest news items we may eventually see is when moody’s downgrades the credit rating of the USA. I think Bob Prechter of Elliott wave fame is looking for the bear market to last maybe 6 more years… so it is going to be quite a long ride…
For those who have not seen it, an analyst (Noyes) of Goldman Sachs out of London created a powerpoint presentation dated 25 June 2010 that was meant only for GS customers of 50+ million. Somehow this presentation got posted to the internet in Yahoo’s Financial Section / TZA Message Board a couple days ago – – I think on Thursday or Friday. The presentation is 31 pages long, sure looks authentic. Worth tracking down and predicts market to go down to S & P 865!
When / if Moodys or S & P ever downgrades USA to less than AAA that will be an incredible day. My guess is that both ratings agencies will be under incredible pressure to delay that pronouncement or even a warning of review for negative implication. They would have to tell Treasury first i would think.
Tom, thanks for your take on Apple. I was thinking of the same stock but the price of puts is astronomical – – – another option is Akamai Technologies (AKAM) – – i was in and out of them on Friday, but think I was wrong to be chicken out. There are several postings today of Prechter’s prediction, see yahoo finance message boards for GLD, TZA (sorry, i can not remember which) and also a full article posted on side panel of Yahoo Finance (July 5 around 8am – – sorry can not remember exactly where)
It sure seems like there are a lot of people calling for a market correction to around 950 or so, so I am now guessing that if some critical support level is breached (1008?) we will wooooosssssh to 950 or so very fast. . . if some important support is breached. I read one commentator yesterday say that if we closed at 9678 or below, that would precipitate an immediate fall a lot lower. Well, we closed on Friday at 9686. This TA gets as bad as Astro aspects. Very very interesting, but I think in the end you have to have a lot of simple fundamental beliefs about where we are headed – – and than hopefully be right and have the courage of convictions to invest that way, and not get so overlevered that you have to close out position before you want to.
Is the Goldman Sachs report based on TA or fundamentals ? It concerns me a bit that Bob P is all over the mainstream media with ultra bearish forecasts. Seems like every time he gets mainstream coverage the market bottoms out. He tends to be more longer term oriented. Anyway I wonder if he called the 87 crash publicly right before it happened. He has made some good calls during recent years.
The GS report is based on TA i think.
Agree on Prechter, but. . . . he was on Fast Money some time in April and the panelists gave him NO ROOM to speak – – they were quite obviously very anti- Prechter. At that time, he would not provide a target price and target date. . . the panelists were openly derisive.
To my recollection Prechter was bearish since August 2009 and yet we had an ensuing 9 months of market rally.