
I have got a bit of a dilemma on my hands. I have been preaching to the choir in recent days and weeks about how bullish the market looks and how it is going back up to the April 2010 highs etc etc.
But after looking at the KBW Bank Index (BKX) and the Russell 2000 it is becoming more and more difficult for me to pound my fists on the table in bullish fashion. I am getting mixed signals.
Could it be that the still somewhat lackluster breakout volume we saw in the SPY ETF recently is a major warning sign that this is a false breakout?
I am becoming open minded to this possible factor now. I am going to allow the sp500 some leeway for a normal pullback to support, but I am going to flip to bearish immediately if we get a close under 1120. I want to allow the sp500 room for a retest of support, but if that support fails then it will have created a 2B Sell signal which is quite bearish.
Any time a stock or index does a breakout, the days work is not done yet. It must then PROVE itself and show that it has the energy to continue higher in bullish fashion. Certainly it can retest new support, but the key is to watch how it tests that support. If support breaks easily like a thin sheet of ice, that can potentially be a big problem.

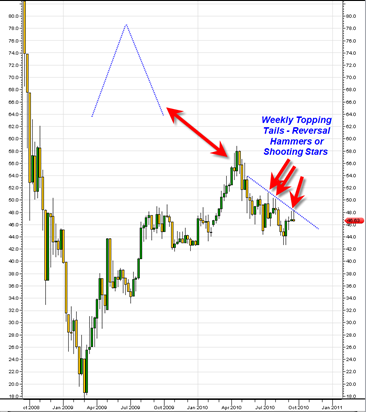
The chart on the left is the BKX banking index. Clearly one can still see that this index is still in a downtrend that looks quite persistent despite the last several weeks rally.
There are two things that concern me. First, the fact that this entire pattern since March 2010 looks like a tower top formation.
Second, the presence of so many WEEKLY topping tails on the candlesticks. This is a weekly candlestick chart and those weekly topping tails (also known as shooting stars) are not a good sign especially since they are forming right near the down trend line. The previous cluster of 2 weekly topping tails led to quite a significant market drop.
So I am looking at the BKX here and thinking to myself… how on earth can I be adamantly bullish the sp500 if the BKX looks so bearish on the weekly? It is creating a bit of a short circuit in my brain. But the end result is that I think I have to dramatically pull in my bullish horns at this point and take more of the attitude that the onus is on the market to prove itself the rest of this week and early next week that it will not break and close under 1120 (on the sp500).
Momentum does seem to be slowing on the upside in the sp500 and there is a chance that if the sp500 actually does break under 1120 it could lead to a large down move. Why? Because there are likely plenty of protective stops near the level, which if triggered can accelerate a down move, not to mention all the automated sell programs.
So at the risk of repeating myself again, let us see the market prove itself in the next few days. I am tempted to make a ‘BOT short’ signal right now, but I am going to hold back until and if we see under 1120 in the days ahead. . .
P.S. October is coming up. October still has that reputation of being a month capable of delivering downside market surprise moves… so lets see if the tape starts configuring that way…
Hey:
I too took a break from the short side and early last week took a long position in RAX. There were so many bullish things happening, I just had to suspend my bearish instinct. Take for example RAX it is a leader in cloud computing, the big boys (HP, Microsoft, etc.) are looking for this type of acquisitions and RAX looked prime. In addition the funds were gobblingn up shares of RAX. Just look at these figures:
Rackspace Hosting, Inc (RAX): Internet Software & Services Industry. Market cap of $2,624B. Short float at 24.97%, which implies a short ratio of 12.09 days. Institutional investors currently own 90,736,939 shares vs. 63,884,522 shares held 3 months ago (+42.03% change). The stock has gained 50.97% over the last year.
Plus it looked like there was a minor up side wave building.
Ergo, I went long!
But now with a reasonable profit in RAX, I am looking at all the technicals and there seems to be a strong case for the downside building.
Of course this is typical of this schizophrenic market! The algorithm boys love to psych out the technical guys!
The truth is I can’t figure this market out. All my indicators are pointing down. So tomorrow AM, I am out of RAX. It makes me sad. But I guess it is better to run away and play another day.
“all my indicators are pointing down”
hope the down direction materializes in some meaningful way. i suspect you may be right, but boy oh boy it is tough being a bear now.
investor sentiment probably got more bullish when Aall Index is put out tomorrow or Friday. my 10 moving average of Advance Decline has been 13 days in positive territory which is by no means a long run (up to 30 days has occurred) but it is sufficient – – it would take another 2 days or so to turn negative. the 10 ma on the Arms / Trin index is .96 which is pretty low meaning there is lots of room some bad days to occur. also the DJI slow stoc is very high at 80+ but that can stay there a long time, but it has potential to obviously fall a lot.
this is very tough market.
Hi Tom
I am also looking at the BKX as slightly worrying I have highlighted a number of previous occasions where this has diverged from a rising SPX on http://www.hometraderuk.blogspot.com.
Also seeing some other worrying signs pn the VIX and volume.
Regards
Steve
Thanks for sharing Steve. Very interesting. It would seem we need the banks to go up if the rest of the market wants to keep going up…