
This may be one of the most important posts I have ever written here at BOT.
There is a key technical analysis event taking place RIGHT NOW in the markets that forces me to tip my hat to the bullish side right now and advise extreme caution on any bearish bets going into next week.
Recently I did a volume analysis of the SPY ETF and it was flashing signals to me that the downward force in terms of volume was not enough to get the job done for the bearish case.
Today we are seeing the market rally and assuming the IWM closes above 60.68 then we will have a confirmed bullish buy signal in the IWM ETF daily price chart versus the MACD Histogram.
Best Online Trades is going long here based on the current setup and our indication before that we would do so assuming a confirmed MACD Histogram buy signal on the IWM. It is not confirmed as of a closing price but I am speculating that it will be by end of day.
There are other things going on as well. The volume today. It is not even mid day or end of day. But I can tell you right now that the volume on the SPY is already 140 million shares which is very heavy before mid day. Whether or not we are able to get double this amount by end of day or close to 300 million shares remains to be seen, but it would be a very significant event if we do in my opinion.
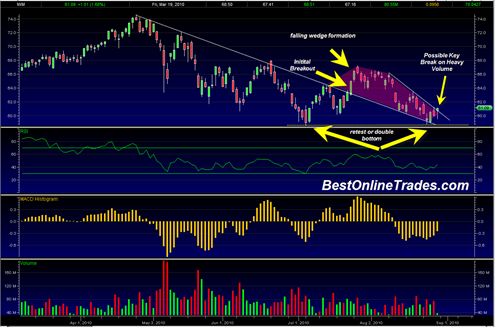
The other important analysis has to do with the IWM Russell 2000 ETF chart structure. Look at the chart below and notice a few important points about this chart structure:

If you look at the IWM chart there is an important context with which to understand the recent action in my opinion. We have the long term bear market resistance line from the April 2010 highs. This line was BUSTED with a price breakout on 7/23/2010 with two price bars and a sign of strength. Volume was robust but not blockbuster volume.
So you had that initial breakout north from the bear market down trend line in late July 2010. Then, the IWM drifted down lower in a retracement back down to the recent lows on LOW VOLUME in the form of a slow retest.
This drift down created a pattern that looks like a falling wedge formation (shaded in red). Now today we are only slightly busting the top of this falling wedge formation on very robust volume. This is an indication to me combined with the MACD histogram buy signal that we are going to bust through this falling wedge and head for the 66 range on the IWM which is the measured target.
The fact that we have fallen back down in the form of a double bottom and falling wedge on low volume is important. I have seen many stocks behave this way at bear market bottoms. They do an initial thrust higher trying to break out topside from bear market trend but then do a 100% retracement and double bottom retest on light volume. Many times this type of market setup leads to a big topside move.
This post was written at 12 noon Eastern Time today. It remains to be seen still how the market closes and whether or not it can close near the top of the range and on the robust volumes I am predicting for end of day. A lot can happen during the second half of the market day, but based on this new look and interpretation of the IWM I have to take the bullish side here and go with it. The IWM chart is speaking to me very loudly today and it is not looking bearish at all right now.
The big money will be back in September to take this market in a determined direction. It is still early, but I think they want to take it higher from here and current prices may be the final bear market lows right now.
Could it actually be possible that Glenn Beck, with his Hindenburg Omen talk on 8/25/2010 has actually nailed the final low in this market ????
Quote
This may be one of the most important posts I have ever written here at BOT.
Unquote
GL
No surprise by the Friday SPX move. As I mentioned before we expected a bounce to fill the 1065 gap. Expect a move Monday AM up to the 1070 channel resistance and then a sharp move down to the channel support around 1025-20. This support is likely to be penetrated in September with a further sharp move downward to complete a (v) wave.
An interesting tell as to how Friday was manipulated look at Boeing. Boeing announced another postponement of its Dreamliner and the stock went up! “When things look too good to be true, they usually are.”
I really do not trust Elliott Wave at all. I realize it has a huge following. But the problem is one never really knows what wave one is in. The counts can completely change at the worst time.
I still think it is useful, but I am too chicken to rely on it for the big signals…
I will wager a “chai” that before this week is out, BOT will have a post that will complete to largely negate this “one of the most important posts I have ever written here at BOT.”
The Aall Index is very bearish this past week, but I am not buying it.
On 8-30 issue, Barron’s quoted from Stock Traders Almanac of 8-23. It is very interesting, but in a nutshell, they project a brief rally (which started Fri) but than down to further low. In other words, I favor the scenario painted by JR in his comment – – maybe not exactly, but the general idea.
This market is a mess. About the only thing that I think that goose this market would be postponement of Bush tax cut expirations. But if that happens, it would really roil the Democrat base, IMHO.
Geoff I agree with you that this market is a total mess. It can’t seem to get anything meaningful going for any extended period of time.
You could be right. I might have to do a complete 180 and it may happen this week if we break below the recent 5 day consolidation.
Also September does not have the best record for upside equity prices and also true that we have not really seen a total capitulation yet since the flash crash.
And we are sitting on the uptrendline since March lows which could break at any moment.
Still for the very short term I have to trust the volume signals. If they do not work then maybe I am analyzing them wrong… I guess we will know in a day or two or three, but certainly by Friday’s Jobs number.